

Suppose that you are a HR manager in a national bank, you have access to historical data
Question:
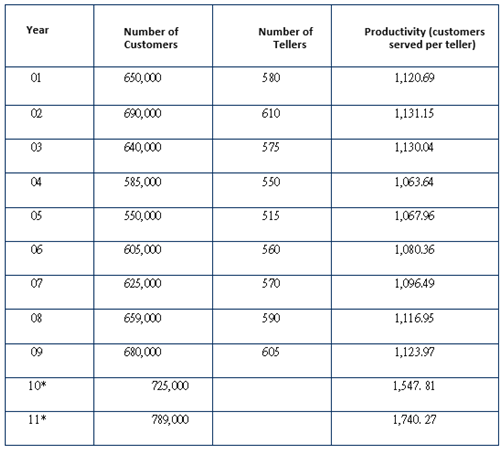
Suppose that you are a HR manager in a national bank, you have access to historical data about branch activity and employment across Canada from 2001 to 2009. These two variables develop a productivity ratio in terms of how many customers each teller is able to serve per year. You are asked to make a quick and rough estimate of teller projections for the bank using this information, and are expected to apply a ratio analysis. The bank is expecting a five percent annual growth rate in their number of customers from 2009 to 2012. This is due to an aggressive marketing technique and the launch of a high- interest banking incentive for customers who leave their existing bank to join yours. As well, because of plans to launch a training and orientation program targeted at all employees, the bank also expects an annual increase in productivity over the next two years. Using this information and the chart with data provided below, predict the organization?s 2010 and 2011 forecasts for HR demand.
Requirements:
1. Plot these figures within WORD on a scatter plot. Estimate a regression line. That is, draw a line that cuts straight through the center of the points (one that minimizes the distance between the lines and the plotted points).
2. Using your plot, estimate the number of tellers needed for forecasted sales of $1,547.81 million and $1,702.27 million.
3. Given the trends and the nature of the banking industry, what other advice can you give the HR planner? Consider online banking, banking locations and hours, services offered, etc.
4. Why might using the plotted information alone be risky?
5. What other factors should you consider? Why?
6. Describe one quantitative and one qualitative technique that can be used to forecast human resources demand.
Expert Answer:
1 Year Number of Customers Number of Tellers Productivity Customer serve per teller 1 650000 580 112069 2 690000 610 113115 3 640000 575 113004 4 5850... View the full answer


Fundamentals of Human Resource Management
ISBN: 978-0077718367
6th edition
Authors: Raymond Noe, John Hollenbeck, Barry Gerhart, Patrick Wright
