

Question: Use the data shown in the table to conduct a design of experiment (DOE) in order to test cause-and-effect relationships in business processes for the
Use the data shown in the table to conduct a design of experiment (DOE) in order to test cause-and-effect relationships in business processes for the company. Determine the graphical display tool (e.g., Interaction Effects Chart, Scatter Chart, etc.) that you would use to present the results of the DOE that you conducted in
1. Provide a rationale for your response. Recommend the main actions that the company could take in order to increase the response rate of its e-mail advertising. Provide a rationale for your response. Propose one (1) overall strategy for developing a process model for this company that will increase the response rate of its e-mail advertising and obtain effective business process. Provide a rationale for your response.
2: Graphical Display Tool for Presenting DOE Results, and Rationale
3: Recommending the Main Actions the Firm Can take to Raise Response Rate to Email Advertising
4: Proposing Overall Tactic for the Development of Process Models for the Company to Improve Response Rate
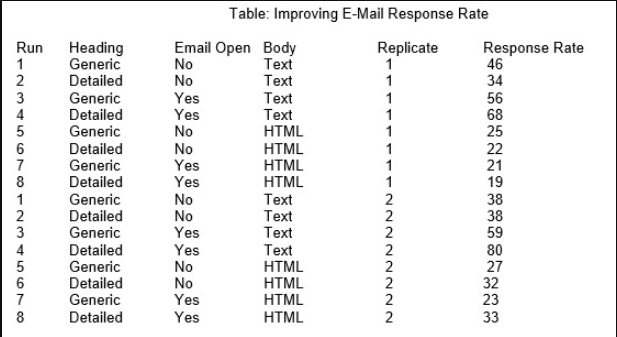
Run Heading Generic Detailed 123456700 - N345678 4 8 1 2 8 Generic Detailed Generic Detailed Generic Detailed Generic Detailed Generic Detailed Generic Detailed Generic Detailed Email Open Body No Text No Text Yes Yes No No Yes Yes No No Yes Yes No No Table: Improving E-Mail Response Rate Replicate 1 1 Yes Yes Text Text HTML HTML HTML HTML Text Text Text Text HTML HTML HTML HTML 1 1 1 2 12222222 Response Rate 46 34 56 68 25 22 21 19 38 38 59 80 27 32 23 33
Step by Step Solution
3.47 Rating (157 Votes )
There are 3 Steps involved in it
To address your questions comprehensively lets go through the process step by step 2 Graphical Display Tool for Presenting DOE Results and Rationale T... View full answer

Get step-by-step solutions from verified subject matter experts