

Use the histograms to compare the times spent commuting for community college students who drive to school
Question:
Use the histograms to compare the times spent commuting for community college students who drive to school in a car with the times spent by those who take the bus. Which group typically has the longer commute time? Which group has the more variable commute time?

Example
NCAA Soccer Players
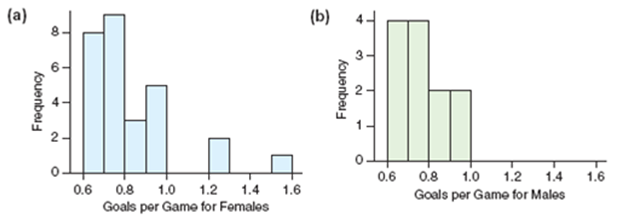
Soccer players who play more games have more opportunities to score goals, so it isn't quite fair to simply look at the number of goals scored in a season. Instead, consider Figure, which shows the number of goals per game (the number of goals a player scores divided by the number of games that she or he played) for women and men first-year players.
Figure
Distribution of goals per game scored during one season for (a) women and (b) men.
QUESTION
Do these men and women soccer players have different variability in the goals scored per game? If so, which group has the greater variability?
Expert Answer:
We use histograms shown below to compare the times spent commuting for commun... View the full answer


Essential Statistics
ISBN: 9780134134406
2nd edition
Authors: Robert Gould, Colleen N. Ryan, Rebecca Wong
