

Use the Peruvian blood pressure data set, provided in the file peruvian.txt. This dataset consists of variables
Question:
Use the Peruvian blood pressure data set, provided in the file peruvian.txt. This dataset consists of variables possibly relating to blood pressures of n = 39 Peruvians who have moved from rural high altitude areas to urban lower altitude areas. The variables in this dataset are: Age, Years, Weight, Height, Calf, Pulse, Systol and Diastol. Before reading the data intoMATLAB, it can be viewed in a text editor.
This question involves the use of multiple linear regression on the Peru data set.
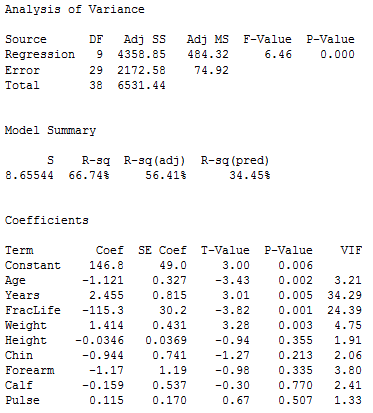
Use the fitlm() function to perform a multiple linear regression with Systol as the response and the other variables as predictors. Comment on the output. For example:
Is there a relationship between the predictors and the response? Which predictors appear to have a statistically significant relationship to the
response? What does the coefficient for the Weight variable suggest?
Use the plotResiduals() and PlotDiagnostics function to produce diagnostic plots of the least squares regression fit. Comment on any problems you see with the fit.
Fit a with
Is there a relationship between the predictors and the response? Which predictors appear to have a statistically significant relationship to the
response? What does the coefficient for the Weight variable suggest?
Use the plotResiduals() and PlotDiagnostics function to produce diagnostic plots of the least squares regression fit. Comment on any problems you see with the fit.
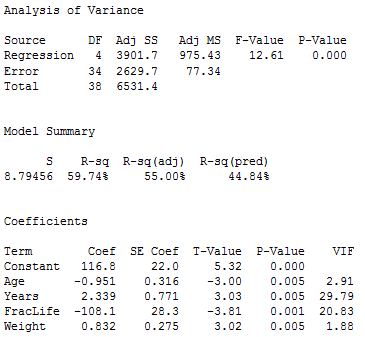
smaller model that only uses the predictors for which there is evidence of association the response. How well do the models in (a) and (b) fit the data?
c) Use the * symbol to fit linear regression models with interaction effects. Do any interactions appear to be statistically significant? Compare the model to the models in (a) and (b). ?
d) Using the information from the correlation matrix you computed above, develop a rational approach to fit a model. Which predictors have you picked and why? How well does the model fit the data? Compare this model to the previous models.
Expert Answer:
This dataset consists of variables possibly relating to blood pressures of n 39 Peruvians who have moved from rural high altitude areas to urban lower altitude areas perutxt The variables in this data... View the full answer


Essentials of Business Statistics Communicating With Numbers
ISBN: 978-0078020544
1st edition
Authors: Sanjiv Jaggia, Alison Kelly
