

Question: 0 Data Table amden Optice tatements.) Ick: $93.47 af during 2016 16 and 2015 Hamden Optical Mart Comparative Income Statements Years Ended December 31, 2016
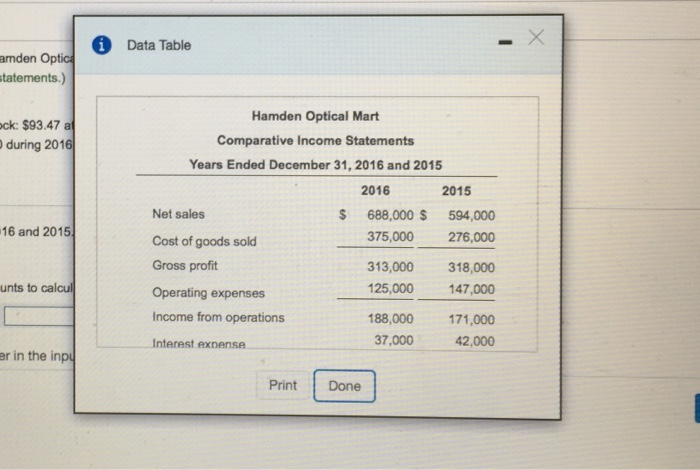
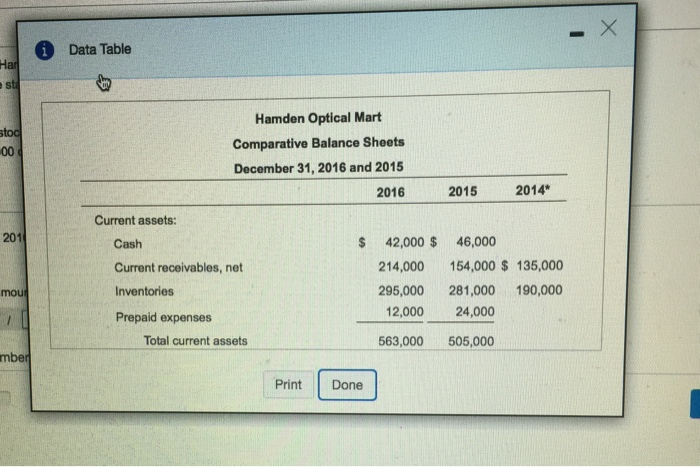
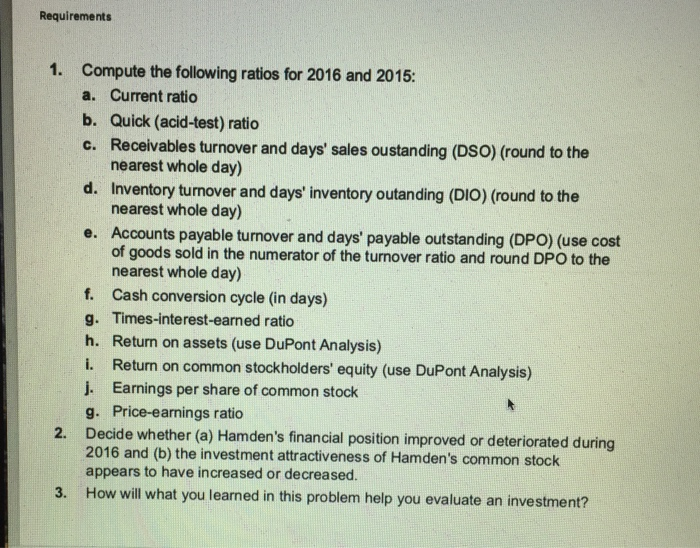
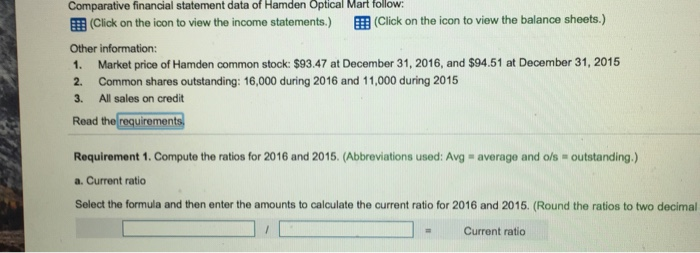
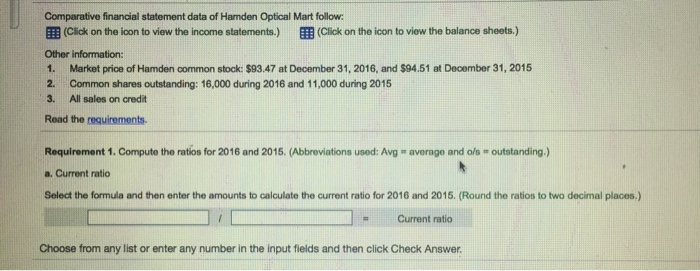
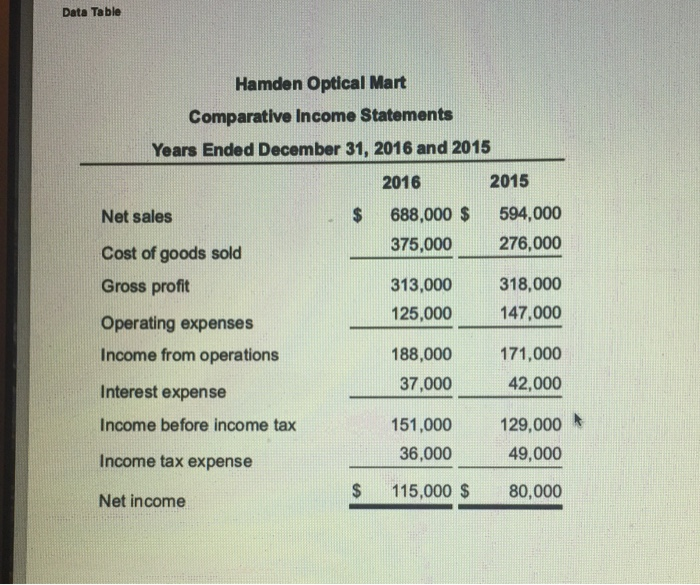
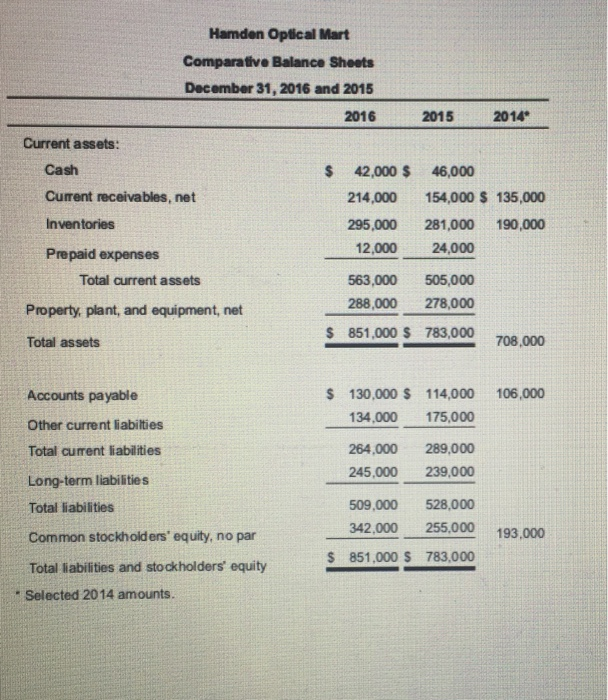
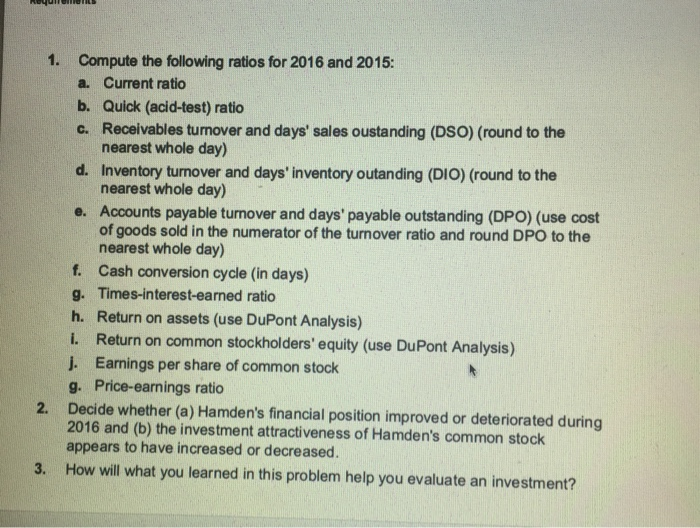
0 Data Table amden Optice tatements.) Ick: $93.47 af during 2016 16 and 2015 Hamden Optical Mart Comparative Income Statements Years Ended December 31, 2016 and 2015 2016 2015 Net sales 688,000 $ 594,000 Cost of goods sold 375,000 276,000 Gross profit 313,000 318,000 Operating expenses 125,000 147,000 Income from operations 188,000 171,000 Interest expense 37,000 42,000 unts to calcul er in the inpy Print Done 0 Data Table Har stog .000 Hamden Optical Mart Comparative Balance Sheets December 31, 2016 and 2015 2016 2015 2014 201 Current assets: Cash Current receivables, net Inventories 42,000 $ 214,000 295,000 12,000 46,000 154,000 $ 135,000 281,000 190,000 24,000 mour Prepaid expenses Total current assets 563,000 505,000 mber Print Done Requirements 1. Compute the following ratios for 2016 and 2015: a. Current ratio b. Quick (acid-test) ratio c. Receivables turnover and days' sales oustanding (DSO) (round to the nearest whole day) d. Inventory turnover and days' inventory outanding (DIO) (round to the nearest whole day) e. Accounts payable turnover and days' payable outstanding (DPO) (use cost of goods sold in the numerator of the turnover ratio and round DPO to the nearest whole day) Cash conversion cycle (in days) g. Times-interest-earned ratio h. Return on assets (use DuPont Analysis) i. Return on common stockholders' equity (use DuPont Analysis) j. Earnings per share of common stock g. Price-earnings ratio 2. Decide whether (a) Hamden's financial position improved or deteriorated during 2016 and (b) the investment attractiveness of Hamden's common stock appears to have increased or decreased. 3. How will what you learned in this problem help you evaluate an investment? Comparative financial statement data of Hamden Optical Mart follow: (Click on the icon to view the income statements.) (Click on the icon to view the balance sheets.) Other information: 1. Market price of Hamden common stock: $93.47 at December 31, 2016, and $94.51 at December 31, 2015 2. Common shares outstanding: 16,000 during 2016 and 11,000 during 2015 3. All sales on credit Read the requirements Requirement 1. Compute the ratios for 2016 and 2015. (Abbreviations used: Avg - average and o/s - outstanding.) a. Current ratio Select the formula and then enter the amounts to calculate the current ratio for 2016 and 2015. (Round the ratios to two decimal - Current ratio Data Table Hamden Optical Mart Comparative Income Statements Years Ended December 31, 2016 and 2015 2016 2015 Net sales 688,000 $ 594,000 Cost of goods sold 375,000 276,000 Gross profit 313,000 318,000 Operating expenses 125,000 147,000 Income from operations 188,000 171,000 Interest expense 37,000 42,000 Income before income tax 151,000 129,000 Income tax expense 36,000 49,000 Net income $ 115,000 $ 80,000 Hamden Optical Mart Comparative Balance Sheets December 31, 2016 and 2015 2016 2015 2014 Current assets: Cash 42,000 $ 46,000 Current receivables, net 214,000 154,000 $ 135,000 Inventories 295,000 281,000 190,000 12,000 24,000 Prepaid expenses Total current assets 563,000 505,000 288,000 278,000 Property, plant, and equipment, net $ 851,000 $ 783,000 Total assets 708,000 106,000 130,000 $ 114,000 134,000 175,000 264.000 245,000 289,000 239,000 Accounts payable Other current liabilties Total current liabilities Long-term liabilities Total liabilities Common stockholders' equity, no par Total liabilities and stockholders' equity Selected 2014 amounts. 509,000 528,000 342,000 851,000 S 783,000 193.000 $ NoyullTILL 1. Compute the following ratios for 2016 and 2015: a. Current ratio b. Quick (acid-test) ratio C. Receivables turnover and days' sales oustanding (DSO) (round to the nearest whole day) d. Inventory turnover and days' inventory outanding (DIO) (round to the nearest whole day) e. Accounts payable turnover and days' payable outstanding (DPO) (use cost of goods sold in the numerator of the turnover ratio and round DPO to the nearest whole day) f. Cash conversion cycle (in days) g. Times-interest-earned ratio h. Return on assets (use DuPont Analysis) I. Return on common stockholders' equity (use DuPont Analysis) 1. Earnings per share of common stock g. Price-earnings ratio 2. Decide whether (a) Hamden's financial position improved or deteriorated during 2016 and (b) the investment attractiveness of Hamden's common stock appears to have increased or decreased. 3. How will what you learned in this problem help you evaluate an investment
Step by Step Solution
There are 3 Steps involved in it

Get step-by-step solutions from verified subject matter experts