

Question: 0 Enter the category width. You are wrong . The category width is not 215.56. To compute the category width, you rst compute the preliminary
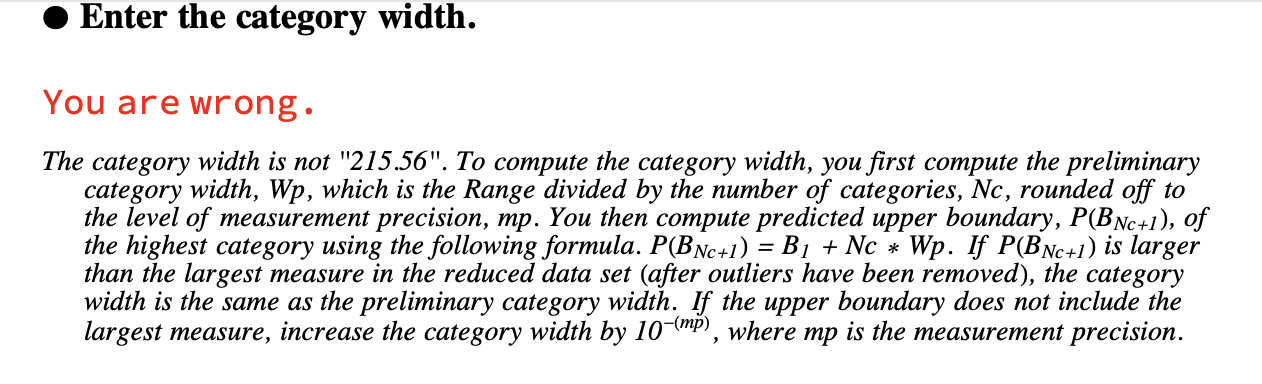
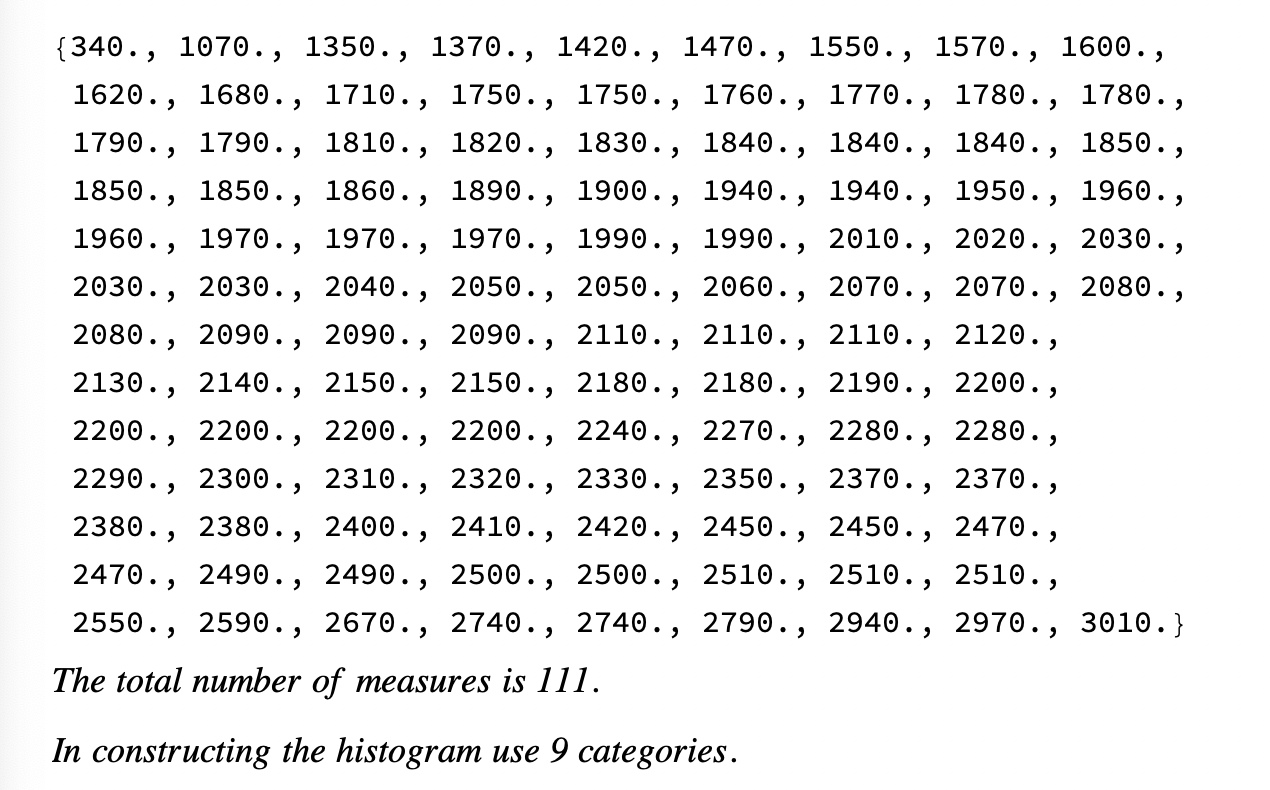
0 Enter the category width. You are wrong . The category width is not "215.56". To compute the category width, you rst compute the preliminary category width, Wp, which is the Range divided by the number of categories, No, rounded o\" to the level of measurement precision, mp. You then compute predicted upper boundary, PORN\" 1), of the highest category using the following formula. P(BNC+;) = B 1 + No x: Wp. K P(BNC+;) is larger than the largest measure in the reduced data set (after outliers have been removed), the category width is the same as the preliminary category width. If the upper boundary does not include the largest measure, increase the category width by 10\"\"), where mp is the measurement precision. 5 5 5 {340., 1070., 1020., 1080. 1790., 1790. 1850., 1850. 1900., 1970. 2030., 2030. 2080., 2090. 2130., 2140. 2200., 2200. 2290., 2300. 2380., 2380. 2470., 2490. 2550., 2590., 1350., 1710. 1810. 1860. 1970. 2040. 2090. 2150. 2200. 2310. 2400. 2490. 5 5 5 1370., 1750. 1820. 1890. 1970. 2050. 2090. 2150. 2200. 2320. 2410. 2500. 2070., 2740., 2740. 5 5 5 1420., 1750. 1830. 1900. 1990. 2050. 2110. 2180. 2240. 2330. 2420. 2500. The total number of measures is 111. 5 1470., 1760. 1840. 1940. 1990. 2060. 2110. 2180. 2270. 2350. 2450. 2510. 2790. In constructing the histogram use 9 categories. 5 1550., 1770. 1840. 1940. 2010. 2070. 2110. 2190. 2280. 2370. 2450. 2510. 2940. 5 1570., 1780. 1840. 1950. 2020. 2070. 2120. 2200. 2280. 2370. 2470. 2510. 2970. 5 1000., 1780., 1850., 1900., 2030., 2080., 3010.}
Step by Step Solution
There are 3 Steps involved in it

Get step-by-step solutions from verified subject matter experts