

Question: ( 1 0 ) A . Tasking: Starting with the data provided, update the data to make it CURRENT and create your own chart, with
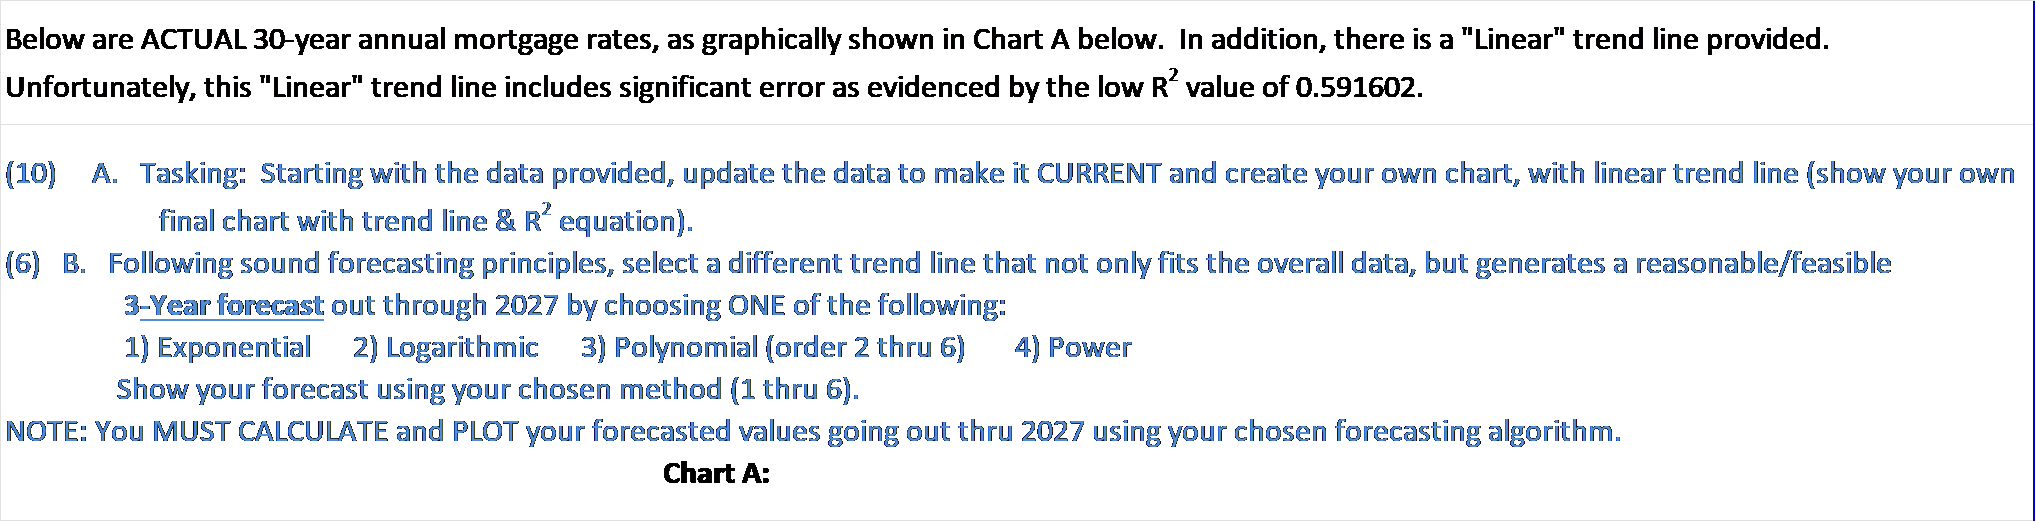
A Tasking: Starting with the data provided, update the data to make it CURRENT and create your own chart, with linear trend line show your own
final chart with trend line & equation
B Following sound forecasting principles, select a different trend line that not only fits the overall data, but generates a reasonablefeasible
Year forecast out through by choosing ONE of the following:
Exponential
Logarithmic
Polynomial order thru
Power
Show your forecast using your chosen method thru
NOTE: You MUST CALCULATE and PLOT your forecasted values going out thru using your chosen forecasting algorithm.
Step by Step Solution
There are 3 Steps involved in it
1 Expert Approved Answer
Step: 1 Unlock

Question Has Been Solved by an Expert!
Get step-by-step solutions from verified subject matter experts
Step: 2 Unlock
Step: 3 Unlock