

Question: Question #4 Forecasting Question #4 (Continued) Below is the average 30-year mortgage rate for 47 years, as graphically shown in Chart A below. In addition,
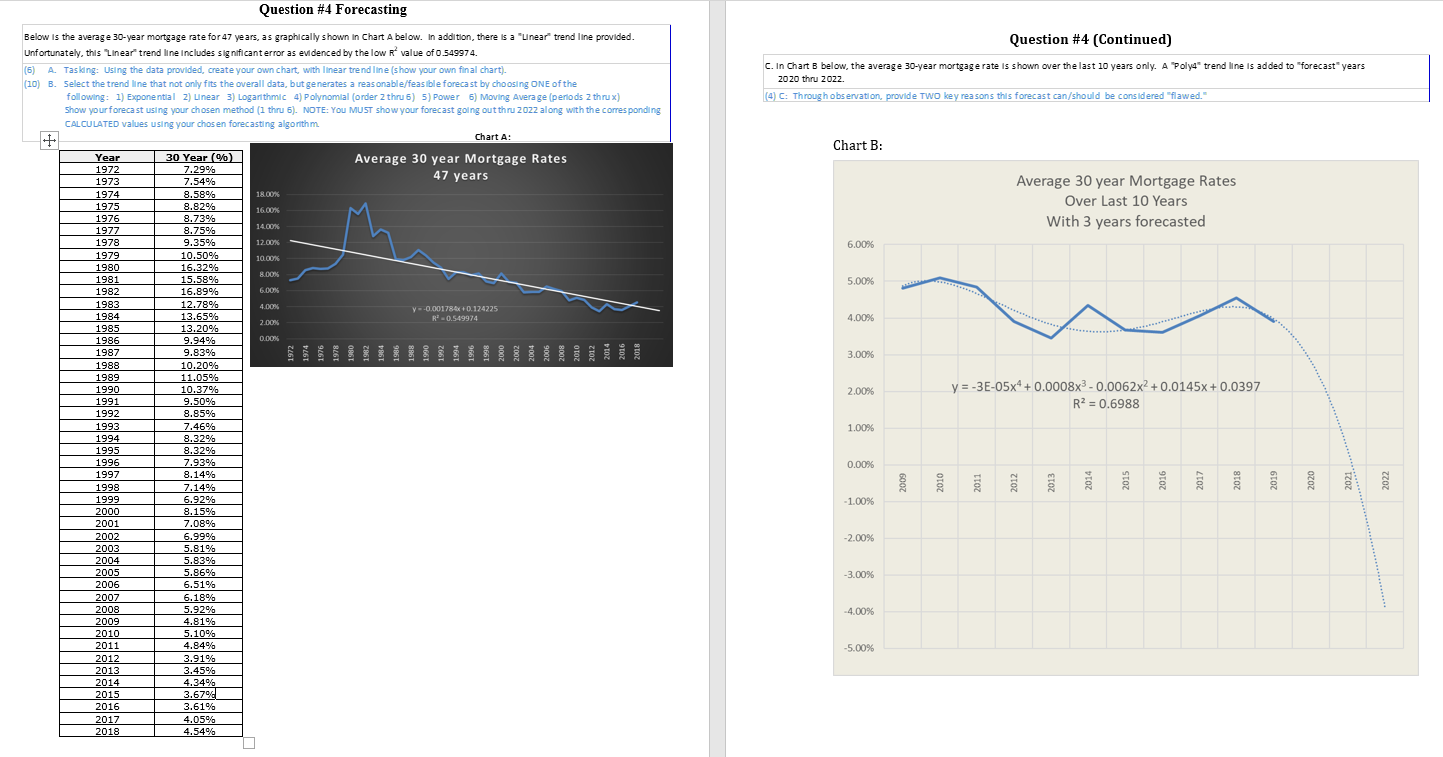
Question #4 Forecasting Question #4 (Continued) Below is the average 30-year mortgage rate for 47 years, as graphically shown in Chart A below. In addition, there is a "Unear trendline provided Unfortunately, this Linear" trend line includes significant error as evidenced by the low Rvalue of 0.549974. (6) A. Tasking: Using the data provided, create your own chart, with linear trendline (show your own final chart). (10) B. Select the trend line that not only fits the overall data, but generates a reasonable/feasible forecast by choosing ONE of the following: 1) Exponential 2) Linear 3) Logarithmic 4) Polynomial (order 2 thru 6) 5) Power 6) Moving Average (periods 2 thru x) Show your forecast using your chosen method (1 thru 6). NOTE: You MUST show your forecast going out thru 2022 along with the corresponding CALCULATED values using your chosen forecasting algorithm Chart A: C. In Chart B below, the average 30-year mortgage rate is shown over the last 10 years only. A Poly4 trend line is added to "forecast years 2020 thru 2022. (4) C: Through observation, provide Two key reasons this forecast can/should be considered "flawed." Chart B: Average 30 year Mortgage Rates 47 years 18.00 16.00% 14.00% 12.00% 10.00% Average 30 year Mortgage Rates Over Last 10 Years With 3 years forecasted 6.00% 8.00% 5.00% -0.001784x+0.124225 R'0.549924 4.00% 2.00% 0.00% 4.00% 3.00% 2.00% y = -3E-05x4 + 0.0008x3 -0.0062x2 +0.0145x+0.0397 R2 = 0.6988 1.00% Year 1972 1973 1974 1975 1976 1977 1978 1979 1980 1981 1982 1983 1984 1985 1986 1987 1988 1989 1990 1991 1992 1993 1994 1995 1996 1997 1998 1999 2000 2001 2002 2003 2004 2005 2006 2007 2008 2009 2010 2011 2012 2013 2014 2015 2016 2017 2018 30 Year (%) 7.29% 7.54% 8.58% 8.82% 8.73% 8.75% 9.35% 10.50% 16.32% 15.58% 16.89% 12.78% 13.65% 13.20% 9.94% 9.83% 10.20% 11.05% 10.37% 9.50% 8.85% 7.46% 8.32% 8.32% 7.93% 8.14% 7.14% 6.92% 8.15% 7.08% 6.99% 5.81% 5.83% 5.86% 6.51% 6.18% 5.92% 4.81% 5.10% 4.84% 3.91% 3.45% 4.34% 3.679% 3.61% 4.05% 4.54% 0.00% 2009 2010 2011 2012 2013 2014 2015 2016 2017 2018 2019 2020 2021 2022 -1.00% -2.00% -3.00% - 4.00% -5.00% 1 Question #4 Forecasting Question #4 (Continued) Below is the average 30-year mortgage rate for 47 years, as graphically shown in Chart A below. In addition, there is a "Unear trendline provided Unfortunately, this Linear" trend line includes significant error as evidenced by the low Rvalue of 0.549974. (6) A. Tasking: Using the data provided, create your own chart, with linear trendline (show your own final chart). (10) B. Select the trend line that not only fits the overall data, but generates a reasonable/feasible forecast by choosing ONE of the following: 1) Exponential 2) Linear 3) Logarithmic 4) Polynomial (order 2 thru 6) 5) Power 6) Moving Average (periods 2 thru x) Show your forecast using your chosen method (1 thru 6). NOTE: You MUST show your forecast going out thru 2022 along with the corresponding CALCULATED values using your chosen forecasting algorithm Chart A: C. In Chart B below, the average 30-year mortgage rate is shown over the last 10 years only. A Poly4 trend line is added to "forecast years 2020 thru 2022. (4) C: Through observation, provide Two key reasons this forecast can/should be considered "flawed." Chart B: Average 30 year Mortgage Rates 47 years 18.00 16.00% 14.00% 12.00% 10.00% Average 30 year Mortgage Rates Over Last 10 Years With 3 years forecasted 6.00% 8.00% 5.00% -0.001784x+0.124225 R'0.549924 4.00% 2.00% 0.00% 4.00% 3.00% 2.00% y = -3E-05x4 + 0.0008x3 -0.0062x2 +0.0145x+0.0397 R2 = 0.6988 1.00% Year 1972 1973 1974 1975 1976 1977 1978 1979 1980 1981 1982 1983 1984 1985 1986 1987 1988 1989 1990 1991 1992 1993 1994 1995 1996 1997 1998 1999 2000 2001 2002 2003 2004 2005 2006 2007 2008 2009 2010 2011 2012 2013 2014 2015 2016 2017 2018 30 Year (%) 7.29% 7.54% 8.58% 8.82% 8.73% 8.75% 9.35% 10.50% 16.32% 15.58% 16.89% 12.78% 13.65% 13.20% 9.94% 9.83% 10.20% 11.05% 10.37% 9.50% 8.85% 7.46% 8.32% 8.32% 7.93% 8.14% 7.14% 6.92% 8.15% 7.08% 6.99% 5.81% 5.83% 5.86% 6.51% 6.18% 5.92% 4.81% 5.10% 4.84% 3.91% 3.45% 4.34% 3.679% 3.61% 4.05% 4.54% 0.00% 2009 2010 2011 2012 2013 2014 2015 2016 2017 2018 2019 2020 2021 2022 -1.00% -2.00% -3.00% - 4.00% -5.00% 1
Step by Step Solution
There are 3 Steps involved in it

Get step-by-step solutions from verified subject matter experts