

Question: 1 0 . Figure 1 is a flow table, and Figure 2 is its Karnaugh state map. Give a Karnaugh flow map which achieves the
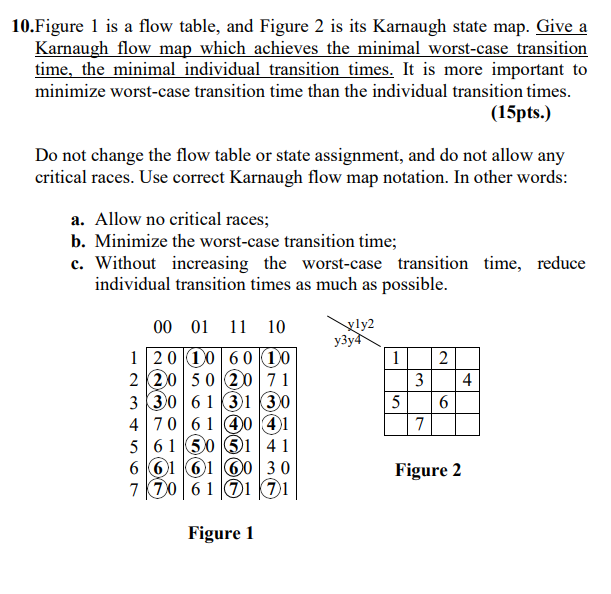
Figure is a flow table, and Figure is its Karnaugh state map. Give a Karnaugh flow map which achieves the minimal worstcase transition time, the minimal individual transition times. It is more important to minimize worstcase transition time than the individual transition times.
pts
Do not change the flow table or state assignment, and do not allow any critical races. Use correct Karnaugh flow map notation. In other words:
a Allow no critical races;
b Minimize the worstcase transition time;
c Without increasing the worstcase transition time, reduce individual transition times as much as possible.
Figure
Figure
Step by Step Solution
There are 3 Steps involved in it
1 Expert Approved Answer
Step: 1 Unlock

Question Has Been Solved by an Expert!
Get step-by-step solutions from verified subject matter experts
Step: 2 Unlock
Step: 3 Unlock