

Question: 1 . ( 1 0 Points ) Use the Excel file Data for Two Stocks to determine the following: a . Using EXCEL s Data
Points Use the Excel file Data for Two Stocks to determine the following:
a Using EXCELs Data Table Feature, create a oneway data table that determines the different means and standard deviations for portfolios consisting of combinations of Stock A and Stock B by varying the correlation coefficient value between Stock A and Stock B through the full range of possible correlation coefficient values. Use increments of for the possible correlation coefficient values.
b Graph the correlation coefficients, the means, and the standard deviations of the portfolios from the oneway data table. Be sure to include a title for the graph and label the axes.
c Use Excels Text Box Feature to explain how the portfolio means are affected by changing the correlation coefficient values.
d Use Excels Text Box Feature to explain how the portfolio standard deviations are affected by changing the correlation coefficient values. begintabularclccc
hline & multicolumnc A & B & C & D
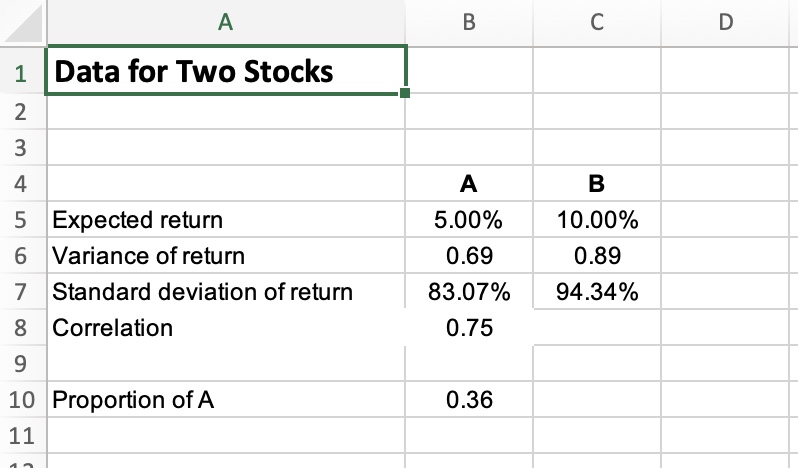
hline & Data for Two Stocks & & &
hline & & & &
hline & & & &
hline & & A & B &
hline & Expected return & & &
hline & Variance of return & & &
hline & Standard deviation of return & & &
hline & Correlation & & &
hline & & & &
hline & Proportion of A & & &
hline & & & &
cline & & & &
hline
endtabular
Step by Step Solution
There are 3 Steps involved in it
1 Expert Approved Answer
Step: 1 Unlock

Question Has Been Solved by an Expert!
Get step-by-step solutions from verified subject matter experts
Step: 2 Unlock
Step: 3 Unlock