

Question: 1 2 3 4 -1 4 2 0 -2 -3 -2 The following four graphs are residual plots from linear regression analyses. Using these
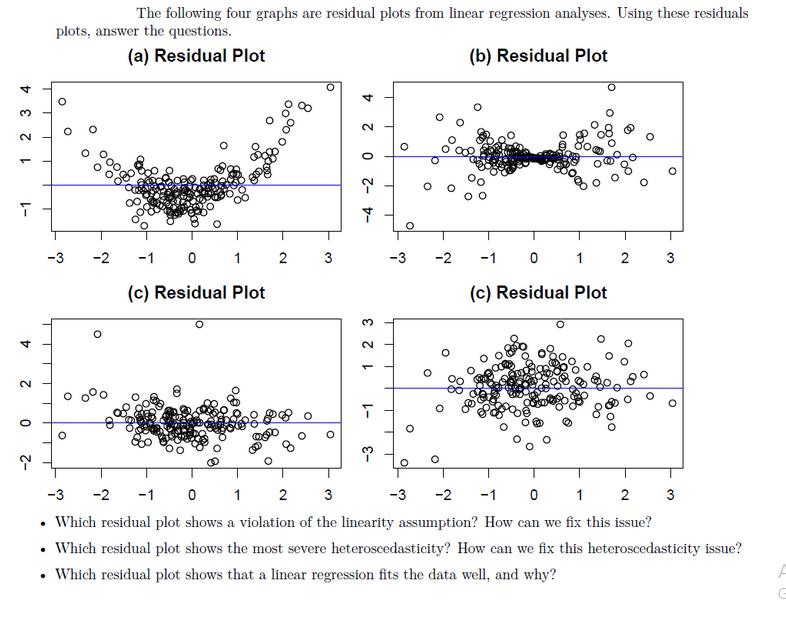
1 2 3 4 -1 4 2 0 -2 -3 -2 The following four graphs are residual plots from linear regression analyses. Using these residuals plots, answer the questions. (a) Residual Plot (b) Residual Plot . . O O -1 0 (c) Residual Plot 8 O 2 3 O 4 2 0 -4 23 T ? O -3 -2 O -1 0 1 (c) Residual Plot 2 O 3 -3 -2 -1 0 1 2 3 -3 -2 -1 0 1 2 Which residual plot shows a violation of the linearity assumption? How can we fix this issue? Which residual plot shows the most severe heteroscedasticity? How can we fix this heteroscedasticity issue? Which residual plot shows that a linear regression fits the data well, and why? O 3 40
Step by Step Solution
There are 3 Steps involved in it
The provided image shows four residual plots from linear regression analyses These plots are used to assess the fit of the linear regression model to ... View full answer

Get step-by-step solutions from verified subject matter experts