

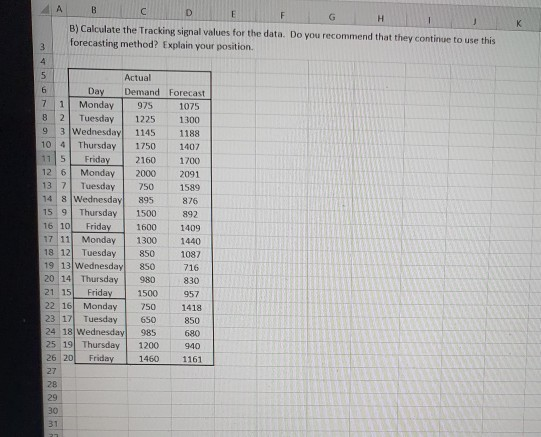
Question: 1) 2) A B C D E F G H 1 B) Calculate the Tracking signal values for the data. Do you recommend that they
1)
2)
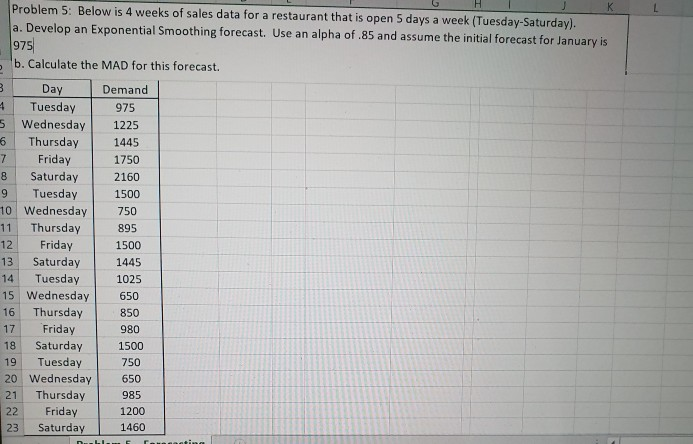
A B C D E F G H 1 B) Calculate the Tracking signal values for the data. Do you recommend that they continue to use this forecasting method? Explain your position 3 4 1 5 Actual 6 Day Demand Forecast Monday 975 1075 8 2 Tuesday 1225 1300 9 3 Wednesday 1145 1188 10 4 Thursday 1750 1407 115 Friday 2160 1700 12 6 Monday 2000 2091 13 7 Tuesday 750 1589 14 8 Wednesday 895 876 15 9 Thursday 1500 892 16 10 Friday 1600 1409 17 11 Monday 1300 1440 18 12 Tuesday 850 1087 19 13 Wednesday 850 716 20 14 Thursday 980 830 21 15 Friday 1500 957 22 16 Monday 1418 23 17 Tuesday 650 850 24 18 Wednesday 985 680 25 19 Thursday 1200 940 26 20 Friday 1460 1161 27 28 29 30 31 750 Problem 5: Below is 4 weeks of sales data for a restaurant that is open 5 days a week (Tuesday-Saturday). a. Develop an Exponential Smoothing forecast. Use an alpha of 85 and assume the initial forecast for January is 975 b. Calculate the MAD for this forecast. 3 4 5 7 Day Tuesday Wednesday 6 Thursday Friday 8 Saturday 9 Tuesday 10 Wednesday 11 Thursday 12 Friday 13 Saturday 14 Tuesday 15 Wednesday 16 Thursday 17 Friday 18 Saturday Tuesday 20 Wednesday 21 Thursday 22 Friday 23 Saturday Demand 975 1225 1445 1750 2160 1500 750 895 1500 1445 1025 650 850 980 1500 750 650 985 1200 1460 19
Step by Step Solution
There are 3 Steps involved in it
1 Expert Approved Answer
Step: 1 Unlock

Question Has Been Solved by an Expert!
Get step-by-step solutions from verified subject matter experts
Step: 2 Unlock
Step: 3 Unlock