

Question: 1 . 2 Plotting discrete data and continuous functions Jupyter Notebook 1 . 1 . Plot the numpy sine function y = s i n
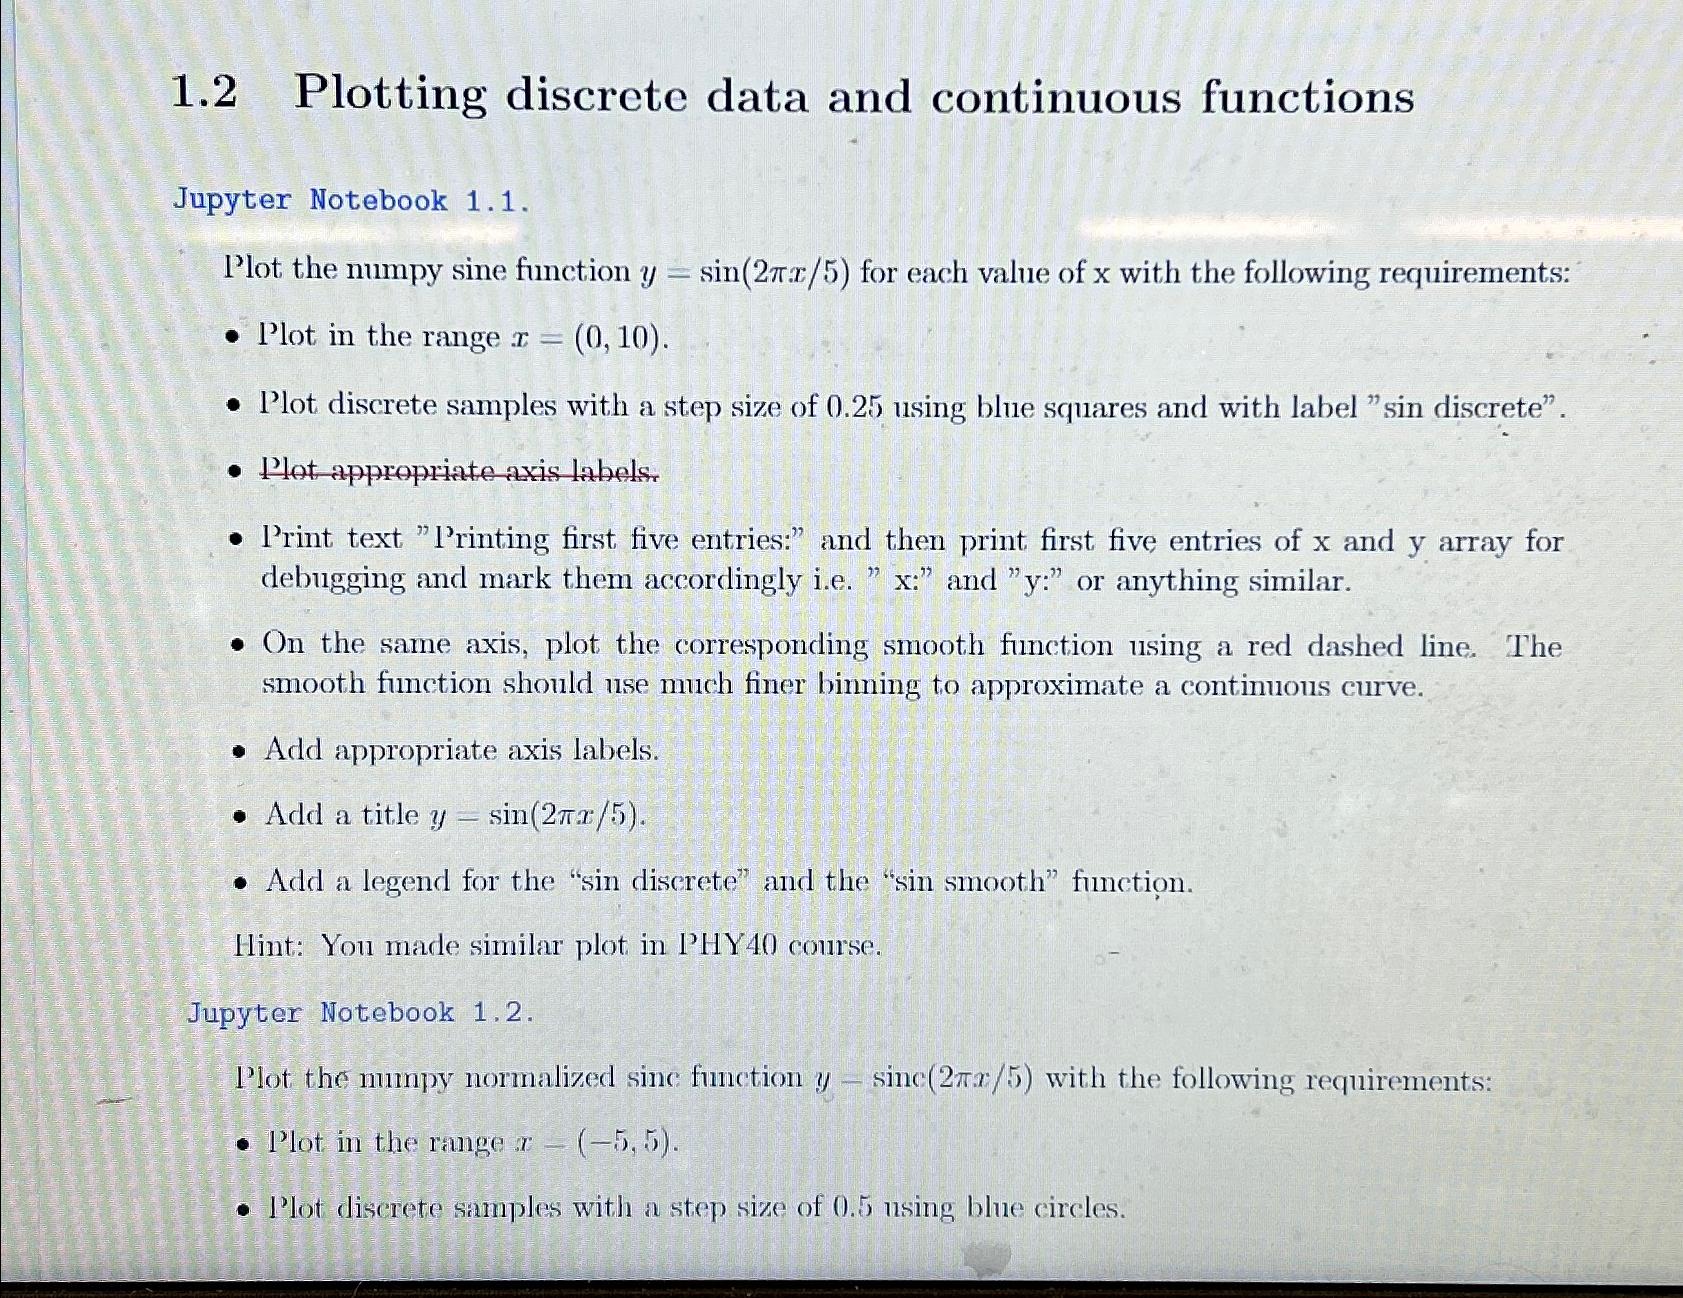
Plotting discrete data and continuous functions
Jupyter Notebook
Plot the numpy sine function for each value of with the following requirements:
Plot in the range
Plot discrete samples with a step size of using blue squares and with label "sin discrete".
Plot appropriate axis labels.
Print text "Printing first five entries:" and then print first five entries of and array for debugging and mark them accordingly iex: and y: or anything similar.
On the same axis, plot the corresponding smooth function using a red dashed line. The smooth function should use much finer binning to approximate a continuous curve.
Add appropriate axis labels.
Add a title
Add a legend for the "sin discrete" and the "sin smooth" function.
Hint: You made similar plot in PHY course.
Jupyter Notebook
I'lot the numpy normalized sinc function with the following requirements:
Plot in the range
Plot discrete samples with a step size of nsing blue circles.
Step by Step Solution
There are 3 Steps involved in it
1 Expert Approved Answer
Step: 1 Unlock

Question Has Been Solved by an Expert!
Get step-by-step solutions from verified subject matter experts
Step: 2 Unlock
Step: 3 Unlock