

Question: Analyzing, Forecasting, and Interpreting Both Income Statement and Balance Sheet Following are the income statements and balance sheets of Best Buy Co., Inc. Income Statement,
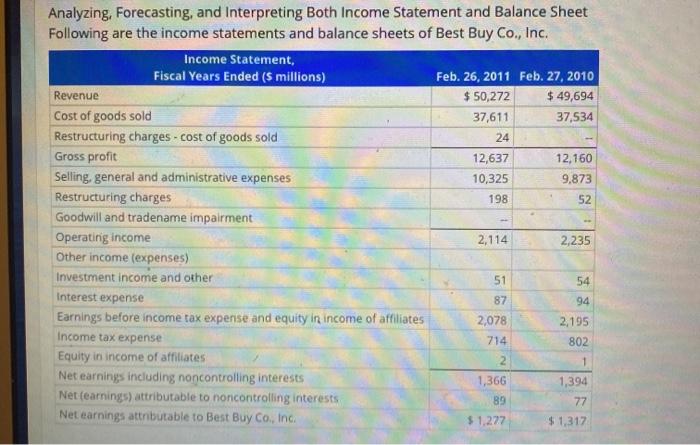
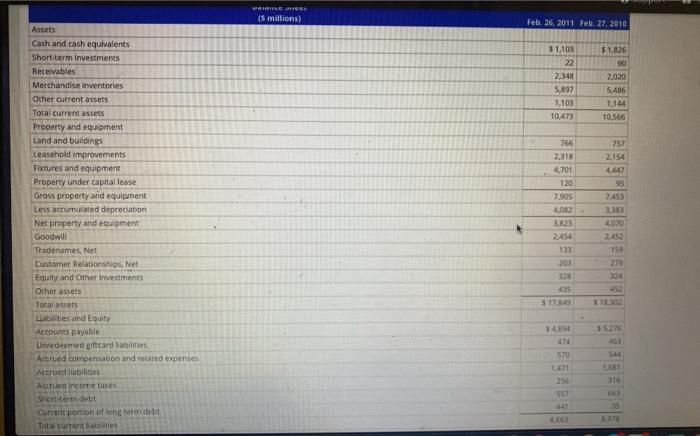
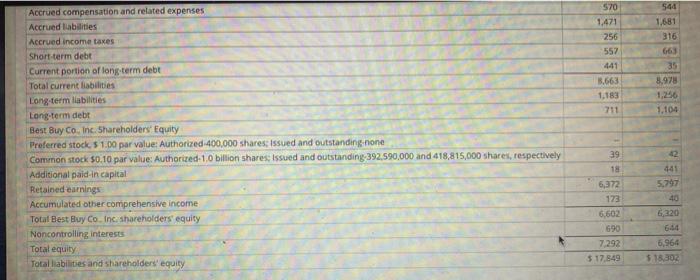
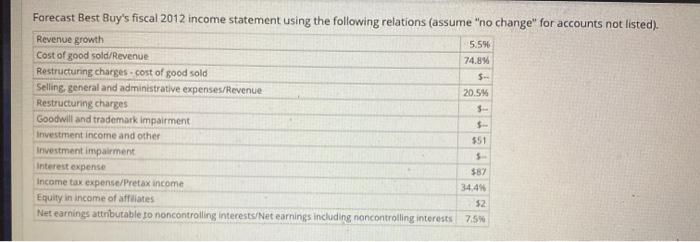
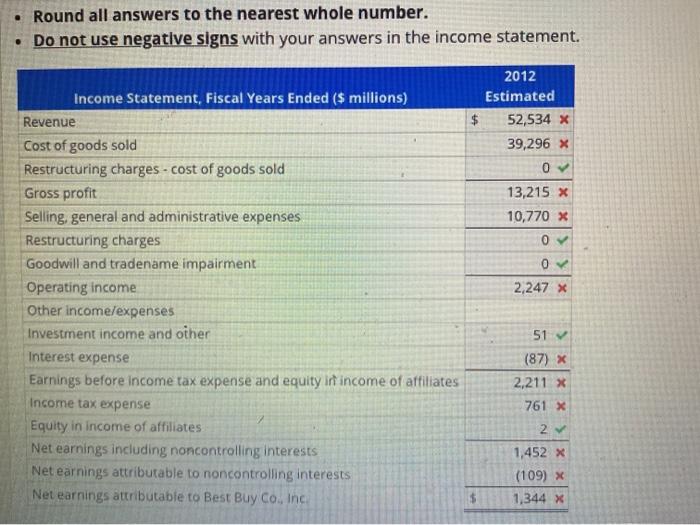
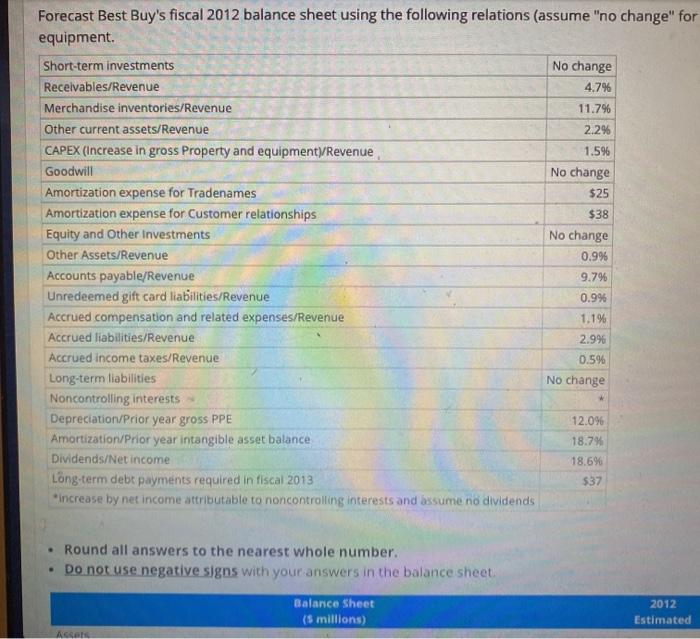
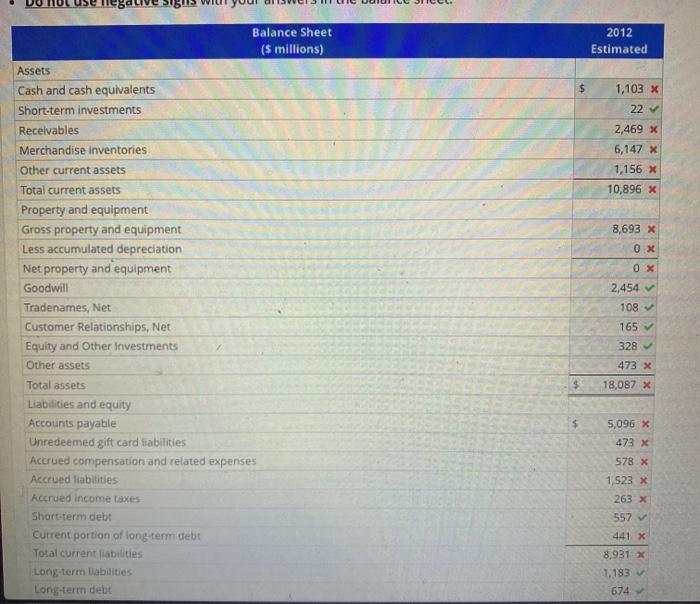
Analyzing, Forecasting, and Interpreting Both Income Statement and Balance Sheet Following are the income statements and balance sheets of Best Buy Co., Inc. Income Statement, Fiscal Years Ended (5 millions) Feb. 26, 2011 Feb. 27, 2010 Revenue $ 50,272 $ 49,694 Cost of goods sold 37,611 37,534 Restructuring charges - cost of goods sold 24 Gross profit 12,637 12,160 Selling, general and administrative expenses 10,325 9.873 Restructuring charges 198 52 Goodwill and tradename impairment Operating income 2,114 2,235 Other income (expenses) Investment income and other 51 54 Interest expense 94 Earnings before income tax experise and equity in income of affiliates 2,078 2,195 Income tax expense 714 802 Equity in income of affiliates 2 Net earnings including noncontrolling interests 1,366 1,394 Net (earnings) attributable to noncontrolling interests 89 77 Net earnings attributable to Best Buy Co., Inc. $1,227 $1,317 87 1 (5 millions) Feb, 26, 2011 Feb. 27, 2010 $1,108 22 2,348 5,897 1,103 10,473 $1,826 GO 2,020 5.486 1.144 10.566 757 2.154 765 2.318 4701 120 95 7.505 4082 3383 4070 Assets Cash and cash equivalents Short-term investments Receivables Merchandise inventories Other current assets Total current assets Property and equipment Land and buildings Leasehold improvements Fixtures and equipment Property under capital lease Gross property and equipment Less accumulated depreciation Net property and equipment Goodwill Tradenames, Net Customer Relationships, Net Equity and Other investments Other assets Totalets Liabilities and Equity Accounts payable Unredeemed giftcard liabilities Accrued compensation and related expenses Accrued alities Accrued income taxes Short-term debt Current portion of long term debt Total current ab 2454 133 203 199 324 4 $17.30 18.30 15.271 570 54 35 UTE 570 1.471 256 557 441 544 1,681 316 663 35 .663 8,978 1.183 711 1.104 Accrued compensation and related expenses Accrued abilities Accrued Income taxes Short-term debt Current portion of long-term debt Total current liabilities Long-term labilities Long-term debt Best Buy Co. Inc. Shareholders' Equity Preferred stock. 5 1.00 par value: Authorized 400,000 shares: issued and outstanding none Common stock 50.10 par value: Authorized: 1,0 billion shares, issued and outstanding 392,590,000 and 418,815,000 shares, respectively Additional paid in capital Retained earnings Accumulated other comprehensive income Total Best Buy Co. Inc. shareholders' equity Noncontrolling interests Total equity Total liabilities and shareholders' equity 39 18 6,372 173 6,602 690 7.292 $ 17,849 5.797 40 6,220 64 6,964 $1.302 Forecast Best Buy's fiscal 2012 income statement using the following relations (assume "no change" for accounts not listed). Revenue growth 5.5% Cost of good sold/Revenue 74.8% Restructuring charges - cost of good sold Selling, general and administrative expenses/Revenue 20.5% Restructuring charges 3- Goodwill and trademark impairment Investment income and other Investment impairment Interest expense $87 Income tax expense/Pretax income 34,4 Equity in income of affiliates 52 Net earnings att butable to noncontrolling interests/Net earnings including noncontrolling interests 7.5% Forecast Best Buy's fiscal 2012 balance sheet using the following relations (assume "no change" for equipment. Short-term investments No change Receivables/Revenue 4.7% Merchandise inventories/Revenue 11.796 Other current assets/Revenue 2.296 CAPEX (Increase in gross Property and equipment Revenue 1.5% Goodwill No change Amortization expense for Tradenames $25 Amortization expense for Customer relationships $38 Equity and Other investments No change Other Assets/Revenue 0.9% Accounts payable/Revenue 9.7% Unredeemed gift card liabilities/Revenue 0.9% Accrued compensation and related expenses/Revenue 1.19 Accrued liabilities/Revenue 2.9% Accrued income taxes/Revenue 0.5% Long-term liabilities No change Noncontrolling interests Depreciation/Prior year gross PPE 12.09 Amortization/Prior year intangible asset balance 18.7% Dividends/Net income 18.6% Long-term debt payments required in fiscal 2013 $37 increase by net income attributable to noncontrolling interests and assume no dividends Round all answers to the nearest whole number. Do not use negative signs with your answers in the balance sheet . Balance Sheet (5 millions) 2012 Estimated Assets 2012 Estimated $ 1,103 x 22 2,469 X 6,147 X 1,156 x 10,896 x 8,693 x OX 0X 2,454 Balance Sheet ($ millions) Assets Cash and cash equivalents Short-term investments Recelvables Merchandise inventories Other current assets Total current assets Property and equipment Gross property and equipment Less accumulated depreciation Net property and equipment Goodwill Tradenames, Net Customer Relationships, Net Equity and Other investments Other assets Total assets Liabilities and equity Accounts payable Unredeemed gift card liabilities Accrued compensation and related expenses Accrued liabilities Accrued income taxes Short-term debt Current portion of long-term debit Total current liabilities Long-term labidities Long-term debt 108 165 328 473 x 18,087 x $ 5,096 X 473 X 578 X 1,523 x 263 x 557 441 X 8,931 X 1,183 674
Step by Step Solution
There are 3 Steps involved in it

Get step-by-step solutions from verified subject matter experts