

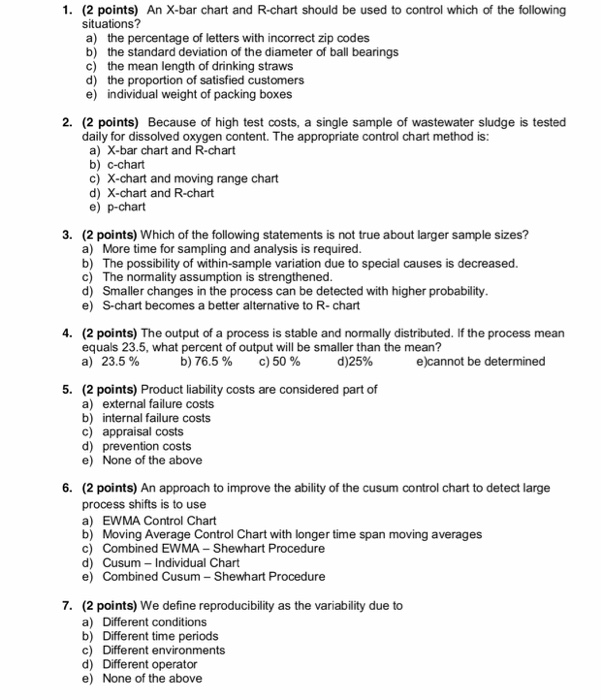
Question: 1. (2 points) An X-bar chart and R-chart should be used to control which of the following situations? a) the percentage of letters with incorrect
Step by Step Solution
There are 3 Steps involved in it
1 Expert Approved Answer
Step: 1 Unlock

Question Has Been Solved by an Expert!
Get step-by-step solutions from verified subject matter experts
Step: 2 Unlock
Step: 3 Unlock