

Question: How are the steps to create the correct histogram from the data provided? How do you calculate the values? Thank you. 3 Section Exercise 3-8
How are the steps to create the correct histogram from the data provided?
How do you calculate the values?
Thank you.
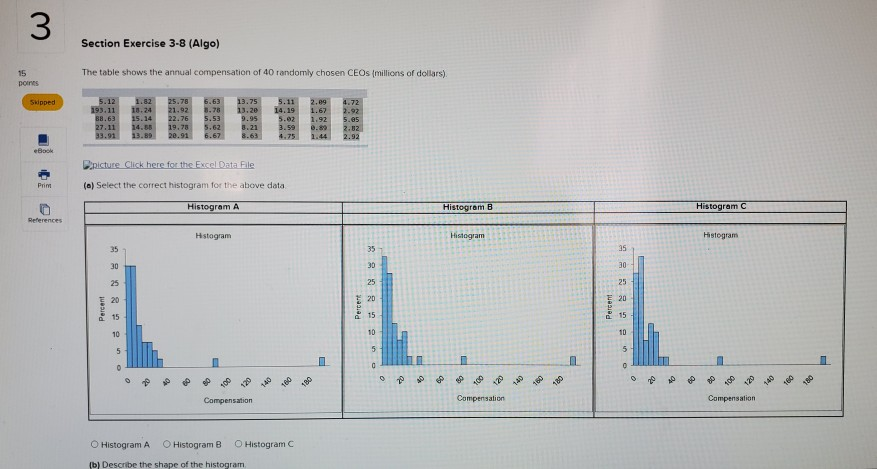
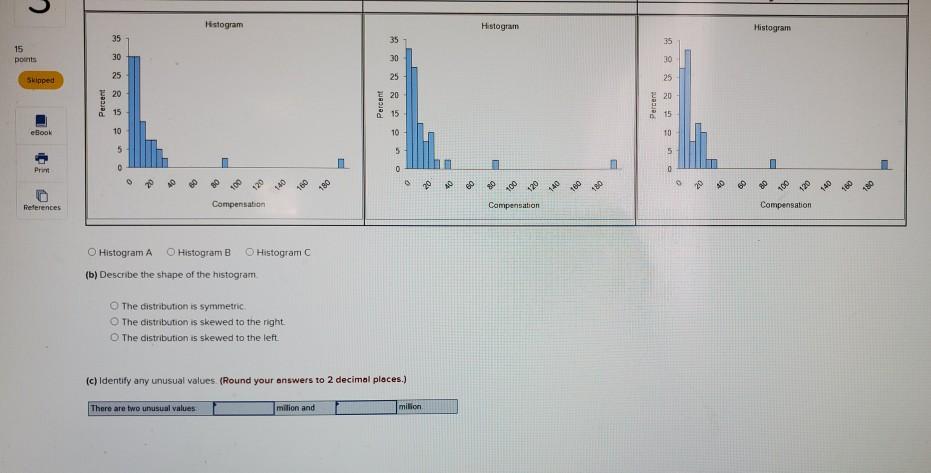
3 Section Exercise 3-8 (Algo) 15 points The table shows the annual compensation of 40 randomly chosen CEOs (millions of dollars) Skipped 6.63 5.12 193.11 B8.63 27.11 33.91 1.82 18.24 15.14 14.55 13.89 25.78 21.92 22.76 19.78 20.91 13.75 13.20 9.95 8.21 5.53 5.62 5.11 14.19 5.02 3.59 4.75 2.69 1.67 1.92 4.72 2.92 5.65 2.02 2.92 1.44 Back C picture Click here for the Excel Data File Prim (a) Select the correct histogram for the above data Histogram A Histogram B Histogram References Histogram Histogram Histogram 35 35 35 30 30 30 25 25 25 20 20 20 Percent Percent Percent 15 15 15 10 10 10 5 5 5 0 0 + 180 140 130 Compensation Compensation Compensation O Histogram A Histogram B Histogram (b) Describe the shape of the histogram Histogram Histogram Histogram 35 35 35 15 points 30 30 30 25 25 Skipped 25 20 20 20 Percent Percent Percent 15 eBook 10 10 10 5 5 5 0 Print 0 0 120 180 180 160 180 References Compensation Compensation Compensation O Histogram A O Histogram B Histogram (b) Describe the shape of the histogram The distribution is symmetric The distribution is skewed to the right The distribution is skewed to the left (c) Identify any unusual values. (Round your answers to 2 decimal places.) There are two unusual values milion and milion
Step by Step Solution
There are 3 Steps involved in it

Get step-by-step solutions from verified subject matter experts