

Question: 1 7 . For the network shown: a . Determine the critical path and the early completion time in weeks for the project b .
For the network shown: a Determine the critical path and the early completion time in weeks for the project b For the data shown, reduce the project completion time by three weeks. Assume a linear cost per week shortened, and show, step by step, how you arrived at your schedule. Activity Normal Time Normal Cost Crash Time Crash Cost A $ $ B $ $ C $ $ D $ $ E $ $ F $ $ G $ $ PLEASE SHOW ALL WORKING AND HOW THE SOLUTION WAS OBTAINEDThe following table represents a plan for a project:
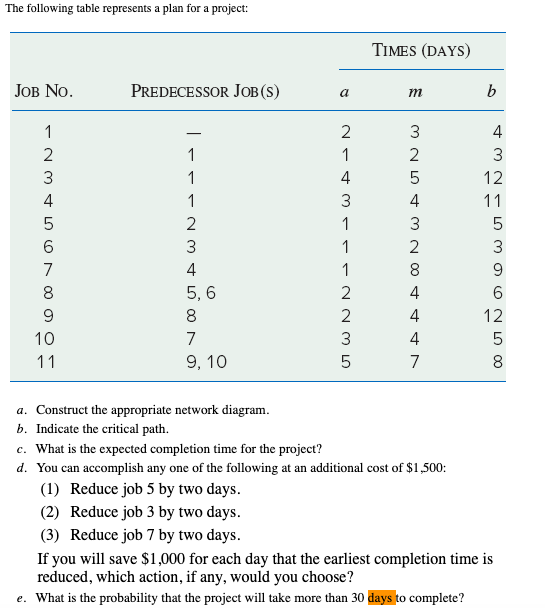
a Construct the appropriate network diagram.
b Indicate the critical path.
c What is the expected completion time for the project?
d You can accomplish any one of the following at an additional cost of $ :
Reduce job by two days.
Reduce job by two days.
Reduce job by two days.
If you will save $ for each day that the earliest completion time is
reduced, which action, if any, would you choose?
e What is the probability that the project will take less than days to complete
Step by Step Solution
There are 3 Steps involved in it
1 Expert Approved Answer
Step: 1 Unlock

Question Has Been Solved by an Expert!
Get step-by-step solutions from verified subject matter experts
Step: 2 Unlock
Step: 3 Unlock