

Question: 1) A milling operation will be monitored using mean and range charts. Eighteen samples of five items were pulled and measured when the process was
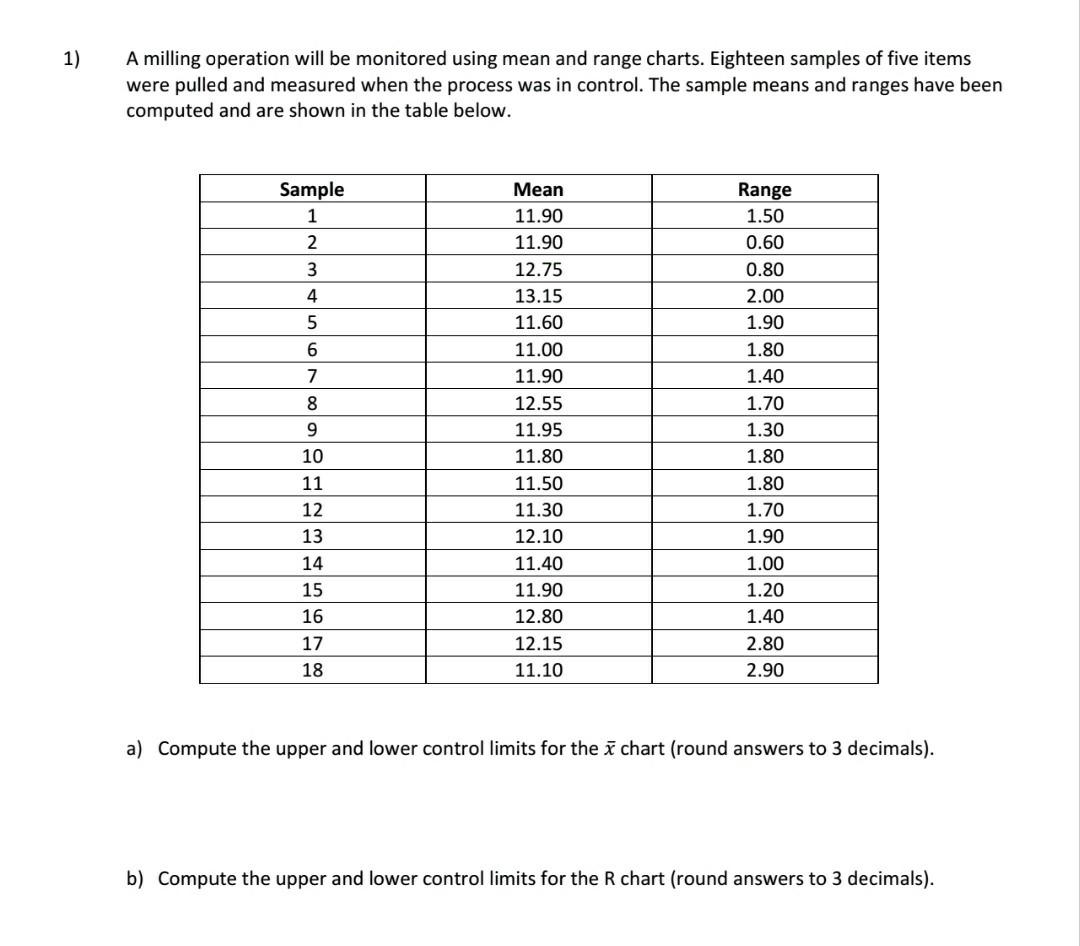
1) A milling operation will be monitored using mean and range charts. Eighteen samples of five items were pulled and measured when the process was in control. The sample means and ranges have been computed and are shown in the table below. Sample 1 2 3 4 5 6 7 8 9 Mean 11.90 11.90 12.75 13.15 11.60 11.00 11.90 12.55 11.95 11.80 11.50 11.30 12.10 11.40 11.90 12.80 12.15 11.10 Range 1.50 0.60 0.80 2.00 1.90 1.80 1.40 1.70 1.30 1.80 1.80 1.70 1.90 1.00 1.20 1.40 2.80 2.90 10 11 12 13 14 15 16 17 18 a) Compute the upper and lower control limits for the i chart (round answers to 3 decimals). b) Compute the upper and lower control limits for the R chart (round answers to 3 decimals)
Step by Step Solution
There are 3 Steps involved in it
1 Expert Approved Answer
Step: 1 Unlock

Question Has Been Solved by an Expert!
Get step-by-step solutions from verified subject matter experts
Step: 2 Unlock
Step: 3 Unlock