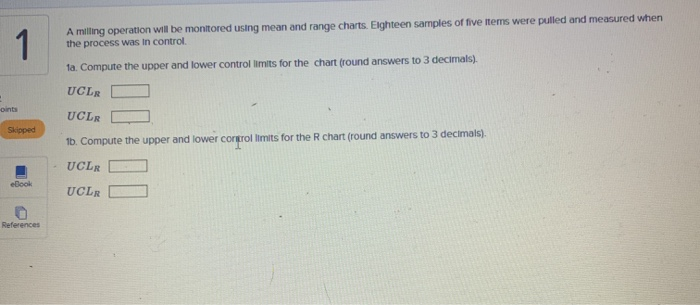
Question: 1 A milling operation will be monitored using mean and range charts. Eighteen samples of five items were pulled and measured when the process was

1 A milling operation will be monitored using
1 A milling operation will be monitored using mean and range charts. Eighteen samples of five items were pulled and measured when the process was in control ta. Compute the upper and lower control limits for the chart (round answers to 3 decimals). UCLR oints Skipped UCLE 1b. Compute the upper and lower control limits for the chart (round answers to 3 decimals). UCLR eBook UCLR References Sample 1 2 3 4 5 6 7 8 9 Mean 11.90 11.90 12.75 13.15 11.60 11.00 11.90 12.55 11.95 11.80 11.50 11.30 12.10 11.40 11.90 12.80 12.15 11.10 Range 1.50 0.60 0.80 2.00 1.90 1.80 1.40 1.70 1.30 1.80 1.80 1.70 1.90 1.00 1.20 1.40 2.80 2.90 10 11 12 13 14 15 16 17 18 Factors for 30 control limits for and R charts Factor for a Charts Az Number of Observations in Subgroup, n 2 3 4 5 6 1.880 1.023 0.729 0.577 0.483 0.419 0.373 0.337 0.308 0.285 7 8 9 10 11 12 13 14 15 16 17 18 19 20 21 0.266 0.249 0.235 0.223 0.212 0.203 0.194 0.187 0.180 0.173 0.167 0.162 0.157 0.153 Factors for R charts D3 D4 0 3.268 0 2.574 0 2.282 0 2.115 0 2.004 0.076 1.924 0.136 1.864 0.184 1.816 0.223 1.777 0.256 1.744 0.284 1.716 0.308 1.692 0.329 1.671 0.348 1.652 0.364 1.636 0.378 1.622 0.391 1.608 0.403 1.597 0.415 1.585 0.425 1.575 0.434 1.556 0.443 1.557 0.451 1.548 0.459 1.541 22 23 24 25

Step by Step Solution

There are 3 Steps involved in it

1 Expert Approved Answer
Step: 1 Unlock blur-text-image
Question Has Been Solved by an Expert!

Get step-by-step solutions from verified subject matter experts

Step: 2 Unlock
Step: 3 Unlock

Students Have Also Explored These Related General Management Questions!