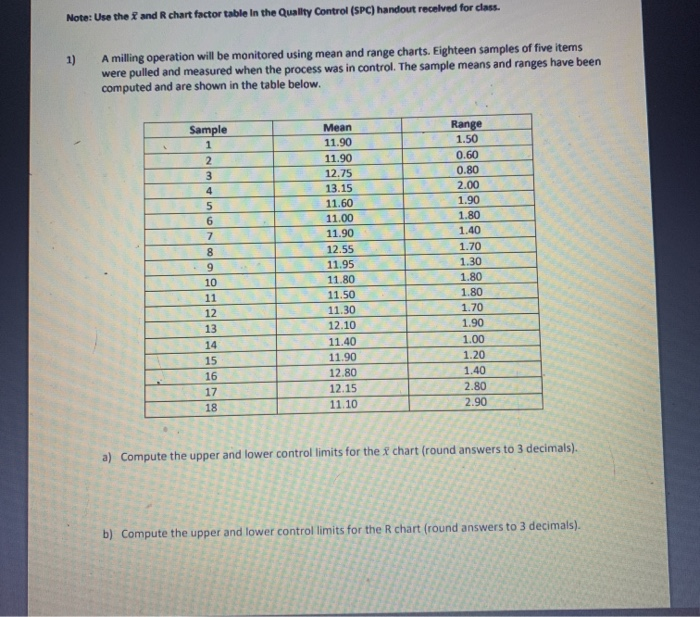
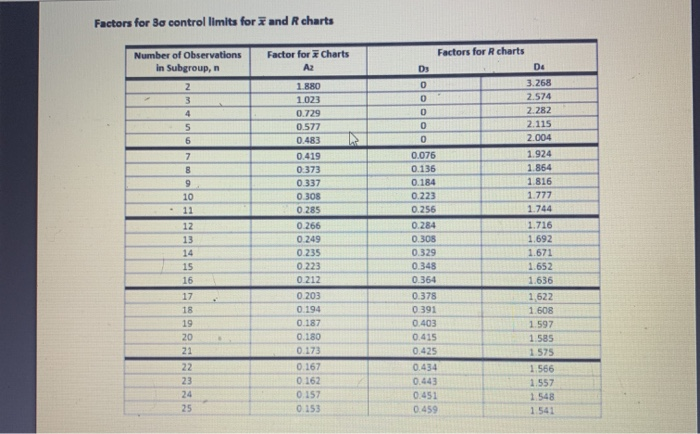
Question: Note: Use the f and R chart factor table in the Quality Control (SPC) handout received for class. 1) A milling operation will be monitored

Note: Use the f and R chart factor table in the
Note: Use the f and R chart factor table in the Quality Control (SPC) handout received for class. 1) A milling operation will be monitored using mean and range charts. Eighteen samples of five items were pulled and measured when the process was in control. The sample means and ranges have been computed and are shown in the table below. Sample 1 2 3 4 5 6 7 8 9 10 11 12 13 14 15 16 17 18 Mean 11.90 11.90 12.75 13.15 11.60 11.00 11.90 12.55 11.95 11.80 11.50 11.30 12.10 11.40 11.90 12.80 12.15 11.10 Range 1.50 0.60 0.80 2.00 1.90 1.80 1.40 1.70 1.30 1.80 1.80 1.70 1.90 1.00 1.20 1.40 2.80 2.90 a) Compute the upper and lower control limits for the chart (round answers to 3 decimals). b) Compute the upper and lower control limits for the chart (round answers to 3 decimals). Factors for Bo control limits for and R charts Factors for R charts Number of Observations in Subgroup, n Factor for Charts Az Ds De 2. 3 4 0 0 0 0 0 5 6 7 8 9 10 11 12 13 14 15 16 17 18 19 20 21 1.880 1.023 0.729 0.577 0.483 0.419 0.373 0.337 0 308 0.285 0.266 0.249 0.235 0223 0.212 0.203 0.194 0.187 0.180 0.173 0.167 0.162 0.157 0.153 0.076 0.136 0.184 0.223 0.256 0.284 0.305 0.329 0.348 0.364 0.378 0 391 0.403 0.415 0.425 0.434 0.443 0.451 0.459 3.268 2.574 2.282 2.115 2.004 1.924 1.864 1.816 1.777 1.744 1.716 1.692 1.671 1.652 1.636 1.622 1.608 1.597 1.585 1.575 1.566 1.557 1.548 1.541 22 23 24 25

Step by Step Solution

There are 3 Steps involved in it

1 Expert Approved Answer
Step: 1 Unlock blur-text-image
Question Has Been Solved by an Expert!

Get step-by-step solutions from verified subject matter experts

Step: 2 Unlock
Step: 3 Unlock

Students Have Also Explored These Related General Management Questions!