

Question: 1 a . Moisture density data for the Proctor test on this soil is given in table below. The weight represents the moisture soil in
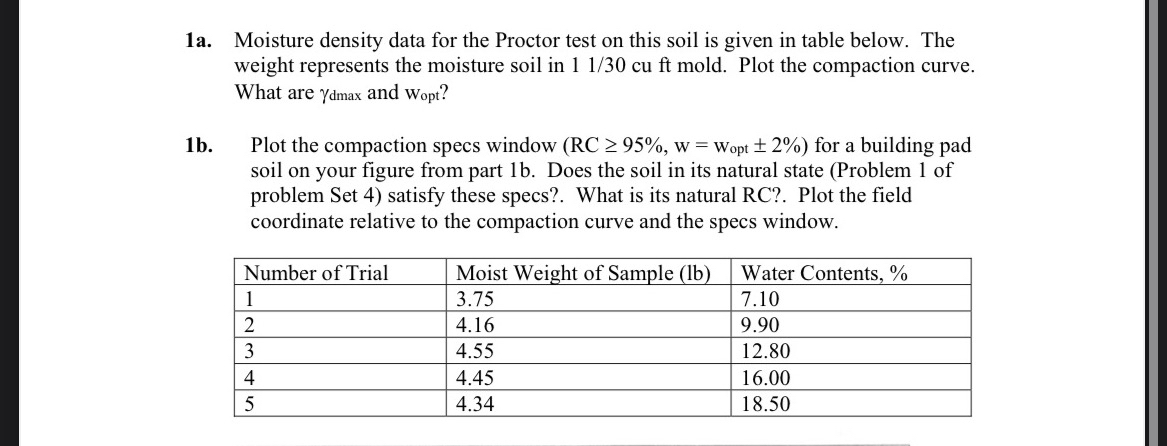
a Moisture density data for the Proctor test on this soil is given in table below. The weight represents the moisture soil in cuft mold. Plot the compaction curve.
What are and
b Plot the compaction specs window for a building pad soil on your figure from part Does the soil in its natural state Problem of problem Set satisfy these specs?. What is its natural RC Plot the field coordinate relative to the compaction curve and the specs window.
tableNumber of Trial,Moist Weight of Sample lbWater Contents, Please show All calulations
Step by Step Solution
There are 3 Steps involved in it
1 Expert Approved Answer
Step: 1 Unlock

Question Has Been Solved by an Expert!
Get step-by-step solutions from verified subject matter experts
Step: 2 Unlock
Step: 3 Unlock