

Question: 1. A student wanted to forecast demand data using weighted moving average while ensuring that more emphasis is placed on more recent data. In order
1.
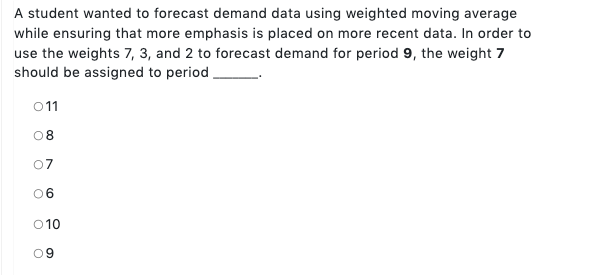
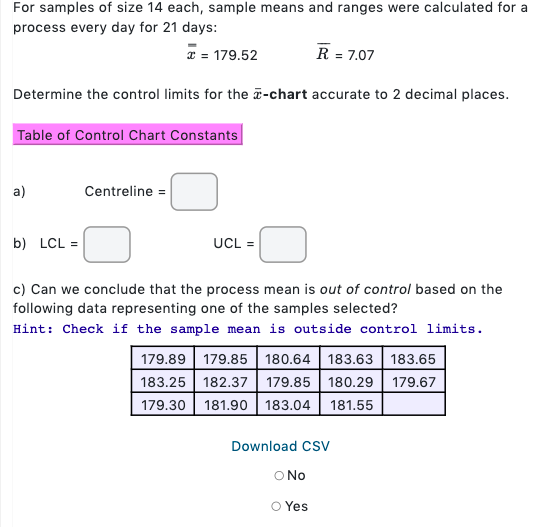
A student wanted to forecast demand data using weighted moving average while ensuring that more emphasis is placed on more recent data. In order to use the weights 7, 3, and 2 to forecast demand for period 9, the weight 7 should be assigned to period 011 08 07 06 010 09For samples of size 14 each, sample means and ranges were calculated for a process every day for 21 days: C = 179.52 R = 7.07 Determine the control limits for the a-chart accurate to 2 decimal places. Table of Control Chart Constants a) Centreline = b) LCL = UCL = c) Can we conclude that the process mean is out of control based on the following data representing one of the samples selected? Hint: Check if the sample mean is outside control limits. 179.89 179.85 180.64 183.63 183.65 183.25 182.37 179.85 180.29 179.67 179.30 181.90 183.04 181.55 Download CSV O No O Yes
Step by Step Solution
There are 3 Steps involved in it

Get step-by-step solutions from verified subject matter experts