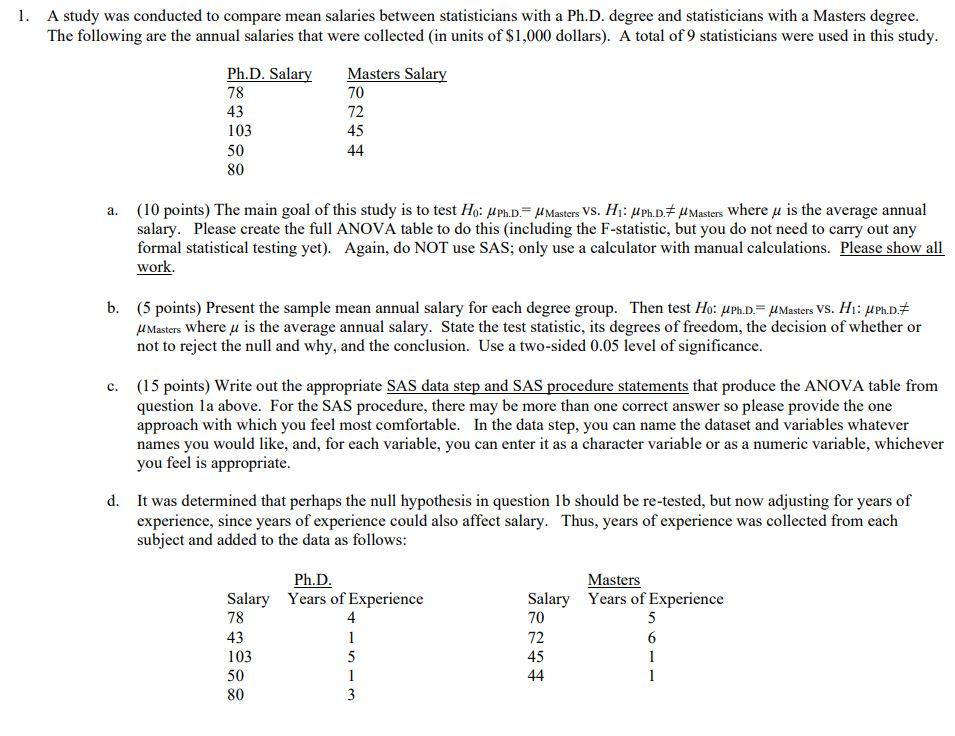
Question: 1. A study was conducted to compare mean salaries between statisticians with a Ph.D. degree and statisticians with a Masters degree. The following are the

1. A study was conducted to compare mean salaries

1. A study was conducted to compare mean salaries between statisticians with a Ph.D. degree and statisticians with a Masters degree. The following are the annual salaries that were collected (in units of $1,000 dollars). A total of 9 statisticians were used in this study. Ph.D. Salary 78 43 103 50 80 Masters Salary 70 72 45 44 a. (10 points) The main goal of this study is to test Ho: ph.d.-ul Masters Vs. Hy: Mph.d.I Masters where u is the average annual salary. Please create the full ANOVA table to do this including the F-statistic, but you do not need to carry out any formal statistical testing yet). Again, do NOT use SAS; only use a calculator with manual calculations. Please show all work. b. (5 points) Present the sample mean annual salary for each degree group. Then test Ho: uph.D.= uMasters Vs. Hi: JPh.D. u Masters where u is the average annual salary. State the test statistic, its degrees of freedom, the decision of whether or not to reject the null and why, and the conclusion. Use a two-sided 0.05 level of significance. c. (15 points) Write out the appropriate SAS data step and SAS procedure statements that produce the ANOVA table from question la above. For the SAS procedure, there may be more than one correct answer so please provide the one approach with which you feel most comfortable. In the data step, you can name the dataset and variables whatever names you would like, and, for each variable, you can enter it as a character variable or as a numeric variable, whichever you feel is appropriate. d. It was determined that perhaps the null hypothesis in question 1b should be re-tested, but now adjusting for years of experience, since years of experience could also affect salary. Thus, years of experience was collected from each subject and added to the data as follows: Ph.D. Salary Years of Experience 78 4 43 1 103 5 50 1 3 Masters Salary Years of Experience 70 5 72 6 45 1 44 1 80

Step by Step Solution

There are 3 Steps involved in it

1 Expert Approved Answer
Step: 1 Unlock blur-text-image
Question Has Been Solved by an Expert!

Get step-by-step solutions from verified subject matter experts

Step: 2 Unlock
Step: 3 Unlock

Students Have Also Explored These Related General Management Questions!