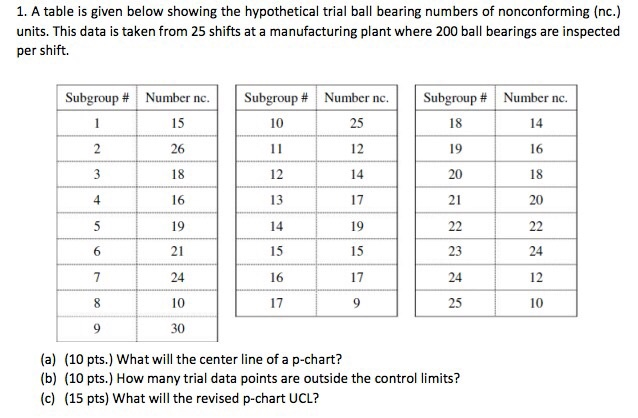
Question: 1. A table is given below showing the hypothetical trial ball bearing numbers of nonconforming (nc.) units. This data is taken from 25 shifts at

1. A table is given below showing the
1. A table is given below showing the hypothetical trial ball bearing numbers of nonconforming (nc.) units. This data is taken from 25 shifts at a manufacturing plant where 200 ball bearings are inspected per shift. Subgroup # Number nc. 15 Subgroup # Number nc. 10 25 11 12 Subgroup # Number nc. 18 14 19 16 2 26 3 18 12 14 20 18 4 16 13 17 21 20 5 19 14 19 22 22 6 21 15 15 23 24 7 24 16 17 24 12 8 17 9 25 10 10 30 9 (a) (10 pts.) What will the center line of a p-chart? (b) (10 pts.) How many trial data points are outside the control limits? (c) (15 pts) What will the revised p-chart UCL

Step by Step Solution

There are 3 Steps involved in it

1 Expert Approved Answer
Step: 1 Unlock blur-text-image
Question Has Been Solved by an Expert!

Get step-by-step solutions from verified subject matter experts

Step: 2 Unlock
Step: 3 Unlock

Students Have Also Explored These Related General Management Questions!