

Question: 1. A velocity-time graph obtained from a CBR is shown. Use the graph to describe the displacewitheltigre graph in each interval. v(t) 4- (mis) 3-
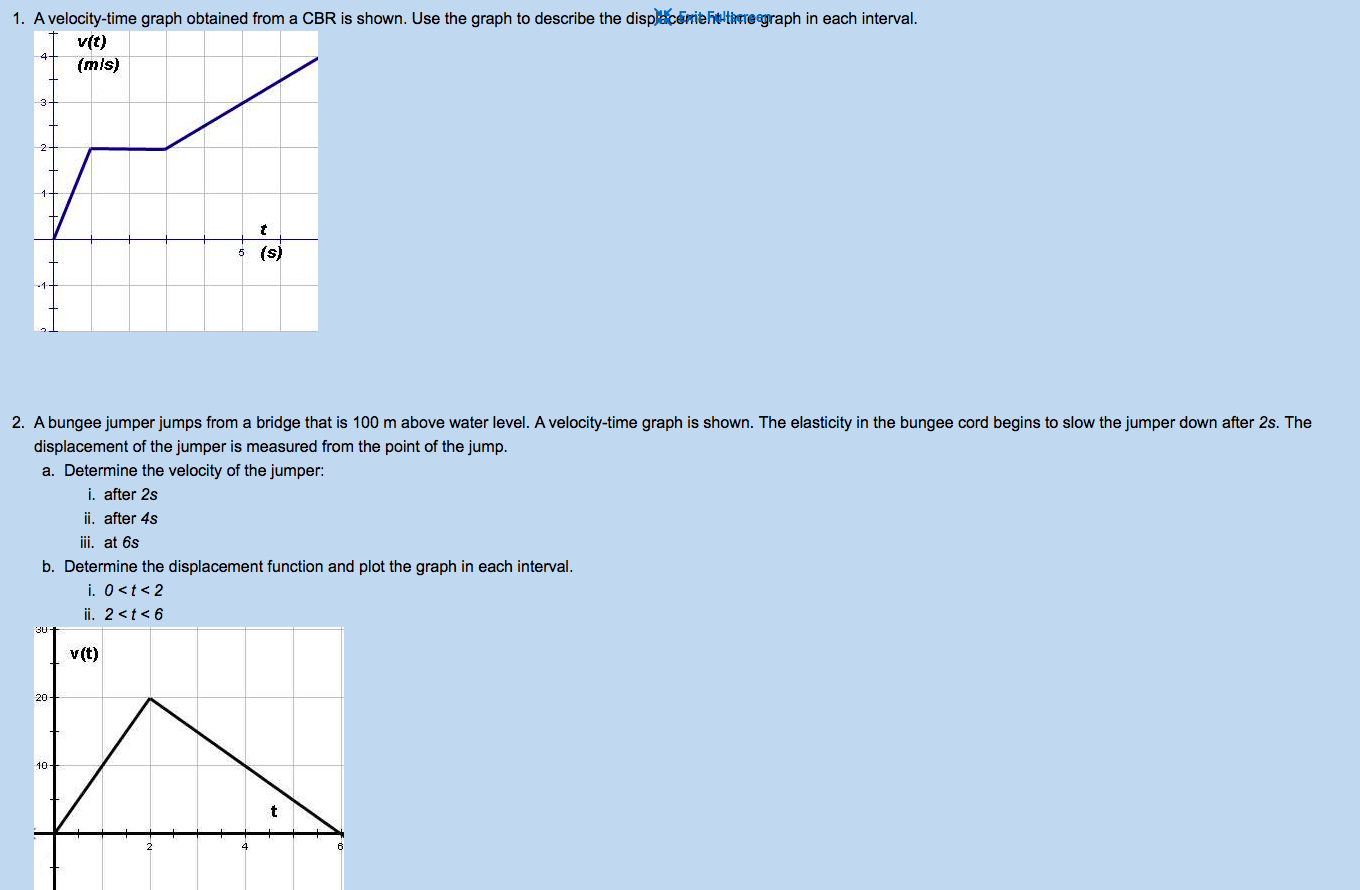
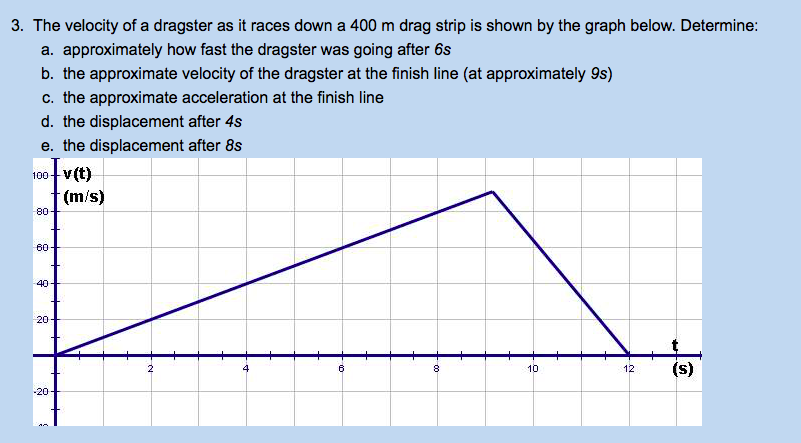
1. A velocity-time graph obtained from a CBR is shown. Use the graph to describe the displacewitheltigre graph in each interval. v(t) 4- (mis) 3- 2 - 5 (s ) 2. A bungee jumper jumps from a bridge that is 100 m above water level. A velocity-time graph is shown. The elasticity in the bungee cord begins to slow the jumper down after 2s. The displacement of the jumper is measured from the point of the jump. a. Determine the velocity of the jumper: i. after 2s ii. after 4s iii. at 6s b. Determine the displacement function and plot the graph in each interval. i. 0
Step by Step Solution
There are 3 Steps involved in it
1 Expert Approved Answer
Step: 1 Unlock

Question Has Been Solved by an Expert!
Get step-by-step solutions from verified subject matter experts
Step: 2 Unlock
Step: 3 Unlock