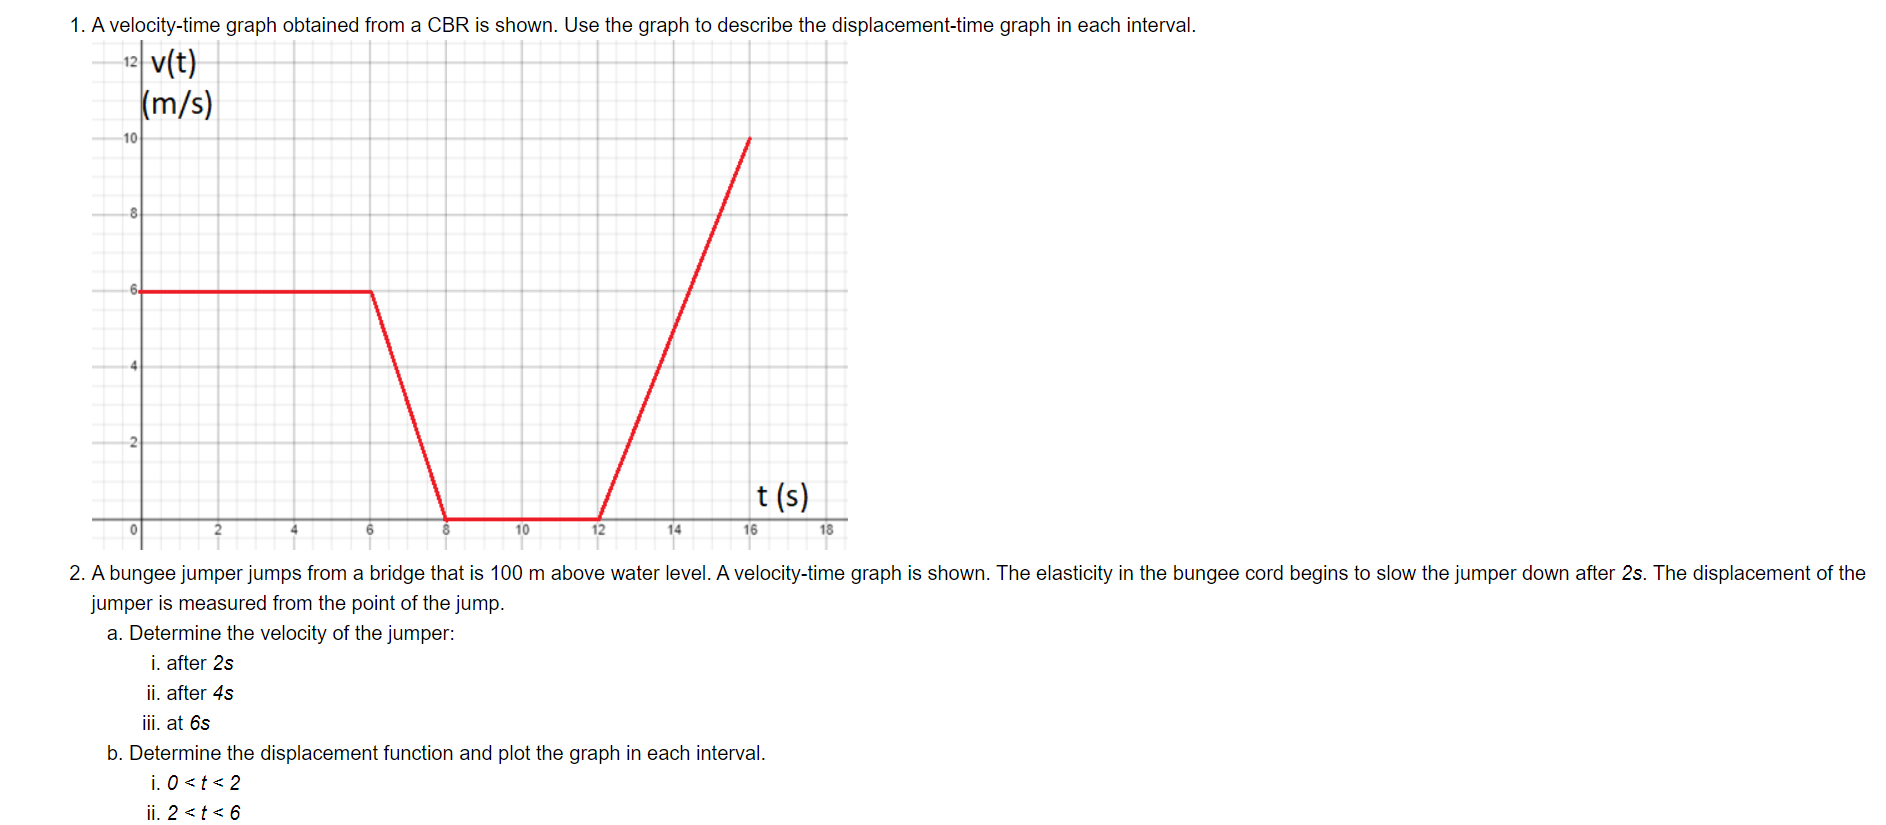
Question: 1. A velocity-time graph obtained from a CBR is shown. Use the graph to describe the displacementtime graph in each interval. M l 2. A

1. A velocity-time graph obtained from a CBR is
1. A velocity-time graph obtained from a CBR is shown. Use the graph to describe the displacementtime graph in each interval. M l 2. A bungee jumperjumps from a bridge that is 100 m above water level. Avelocitytime graph is shown. The elasticity in the bungee cord begins to slow the jumper down after 25. The displacement of the jumper is measured from the point of thejump. a. Determine the velocity of the jumper: i. after 25 ii. after 45 iii. at SS b. Determine the displacement function and plot the graph in each interval. i. 0

Step by Step Solution

There are 3 Steps involved in it

1 Expert Approved Answer
Step: 1 Unlock blur-text-image
Question Has Been Solved by an Expert!

Get step-by-step solutions from verified subject matter experts

Step: 2 Unlock
Step: 3 Unlock

Students Have Also Explored These Related Mathematics Questions!