

Question: 1 A waiting time problemu (queuing), that cannot be modeled by standard distribution, has been simulated. The table below shows the result of a Monte
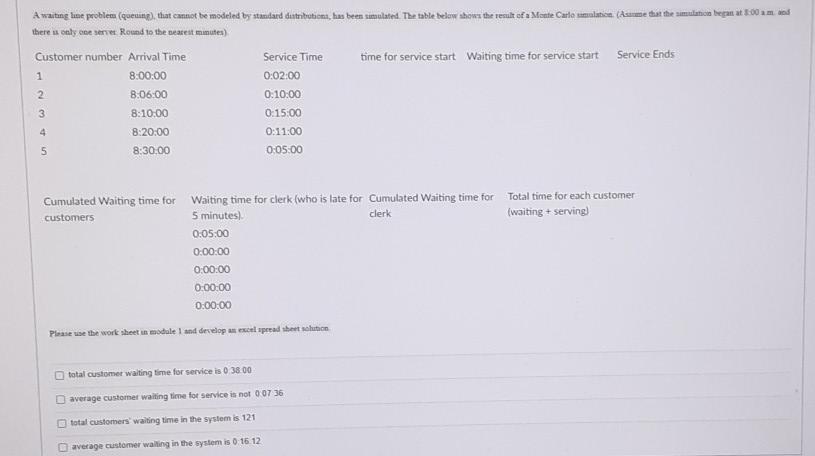
1 A waiting time problemu (queuing), that cannot be modeled by standard distribution, has been simulated. The table below shows the result of a Monte Carlo tumulation (Anne that the simulation began at 3:00 am and there is only one senet Round to the nearest minutes) Customer number Arrival Time Service Time time for service start Waiting time for service start Service Ends 8:00:00 0:02:00 2 8.06:00 0:10:00 8:10:00 0.15:00 8:20:00 0:11:00 8:30:00 0:05:00 3 4 5 clerk Cumulated Waiting time for Waiting time for clerk (who is late for Cumulated Waiting time for Total time for each customer customers 5 minutes) (waiting + serving) 0:05:00 0:00:00 0:00:00 0:00:00 0:00:00 Please use the work sheet in module 1 and develop an excel aperad best solution total customer walting time for service is 03800 B average customer waiting time for service is not 007 36 total customers' waiting time in the system is 121 average customer walling in the system is 0 15.12
Step by Step Solution
There are 3 Steps involved in it
1 Expert Approved Answer
Step: 1 Unlock

Question Has Been Solved by an Expert!
Get step-by-step solutions from verified subject matter experts
Step: 2 Unlock
Step: 3 Unlock