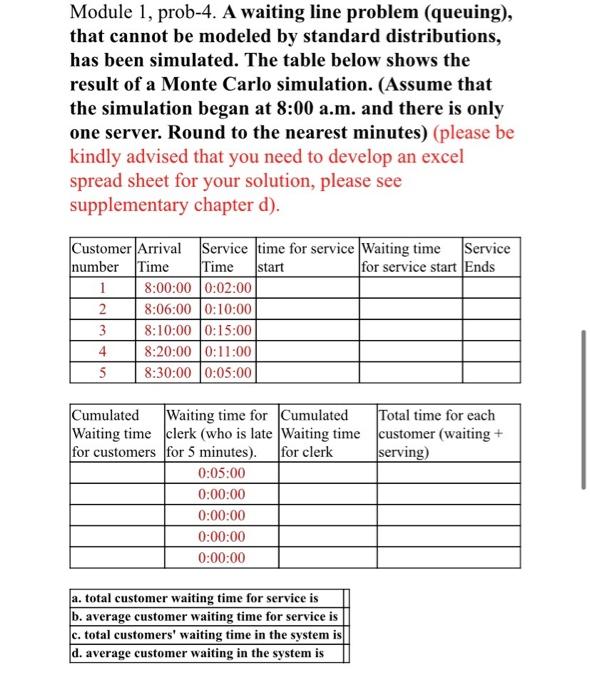
Question: Module 1, prob-4. A waiting line problem (queuing), that cannot be modeled by standard distributions, has been simulated. The table below shows the result of

Module 1, prob-4. A waiting line problem
Module 1, prob-4. A waiting line problem (queuing), that cannot be modeled by standard distributions, has been simulated. The table below shows the result of a Monte Carlo simulation. (Assume that the simulation began at 8:00 a.m. and there is only one server. Round to the nearest minutes) (please be kindly advised that you need to develop an excel spread sheet for your solution, please see supplementary chapter d). Customer Arrival Service time for service Waiting time Service number Time Time start for service start Ends 1 8:00:00 0:02:00 2 8:06:00 0:10:00 3 8:10:00 0:15:00 4 8:20:00 0:11:00 5 8:30:00 0:05:00 Cumulated Waiting time for Cumulated Total time for each Waiting time clerk (who is late Waiting time customer (waiting + for customers for 5 minutes). for clerk serving) 0:05:00 0:00:00 0:00:00 0:00:00 0:00:00 a. total customer waiting time for service is b. average customer waiting time for service is c. total customers' waiting time in the system i mis d. average customer waiting in the system is

Step by Step Solution

There are 3 Steps involved in it

1 Expert Approved Answer
Step: 1 Unlock blur-text-image
Question Has Been Solved by an Expert!

Get step-by-step solutions from verified subject matter experts

Step: 2 Unlock
Step: 3 Unlock

Students Have Also Explored These Related General Management Questions!