

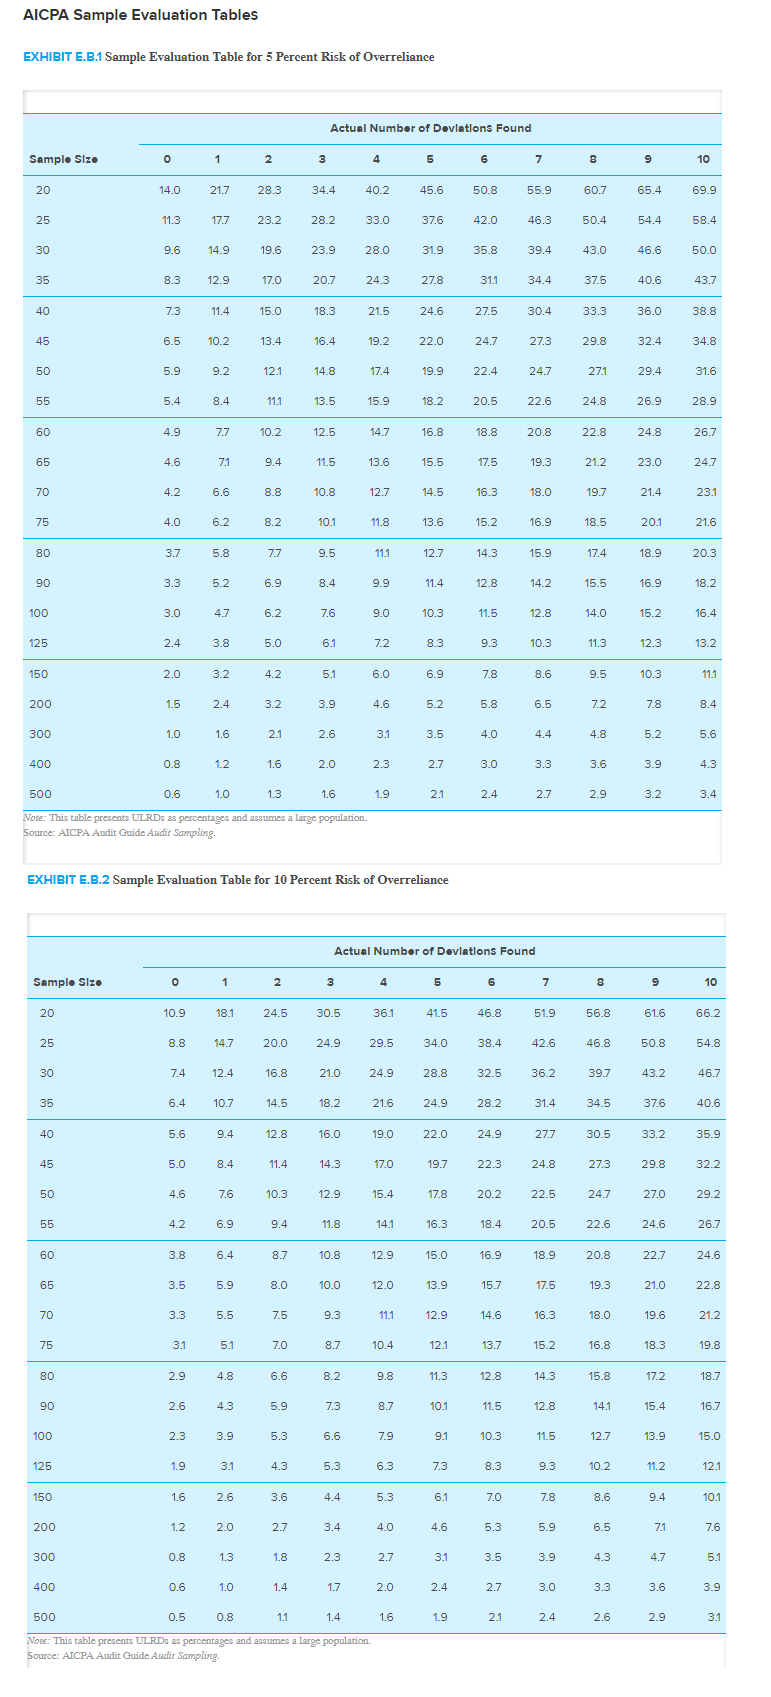
Question: 1. AICPA Sample Evaluation Tables EXHIBIT E.B.1 Sample Evaluation Table for 5 Percent Risk of Overreliance Actual Number of Deviations Found 10 6 B Sample
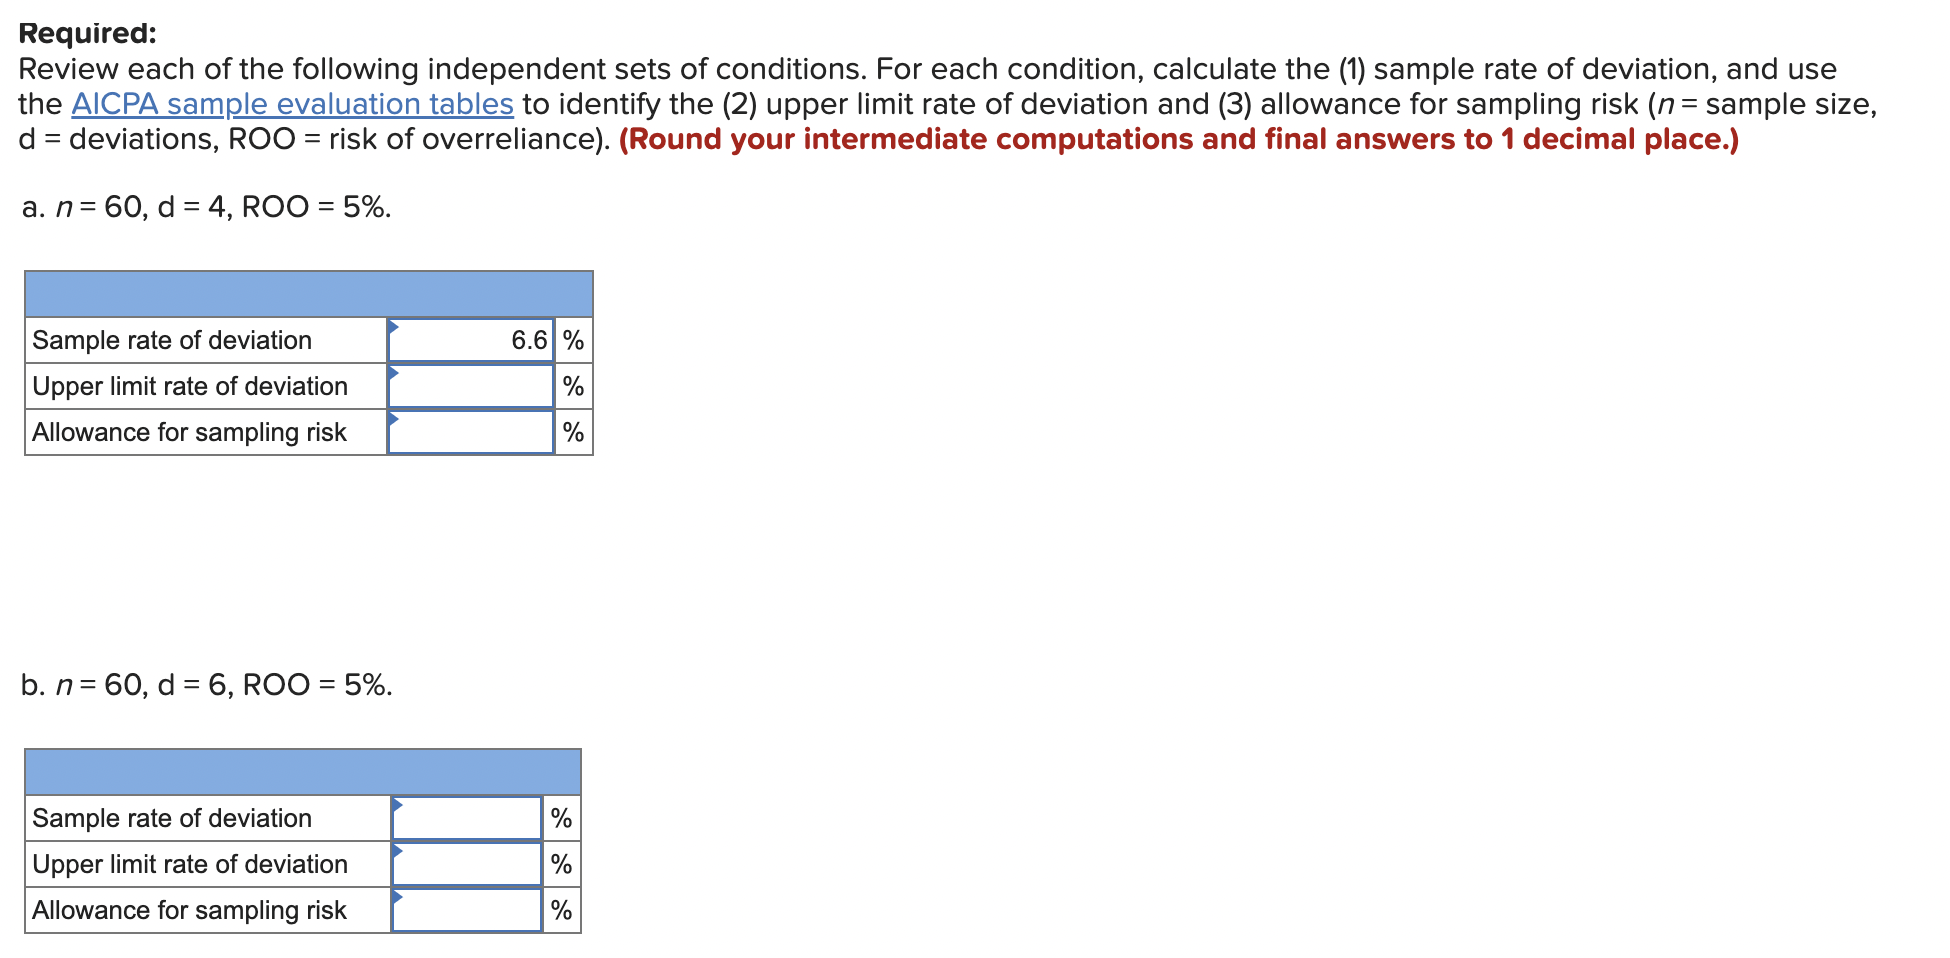
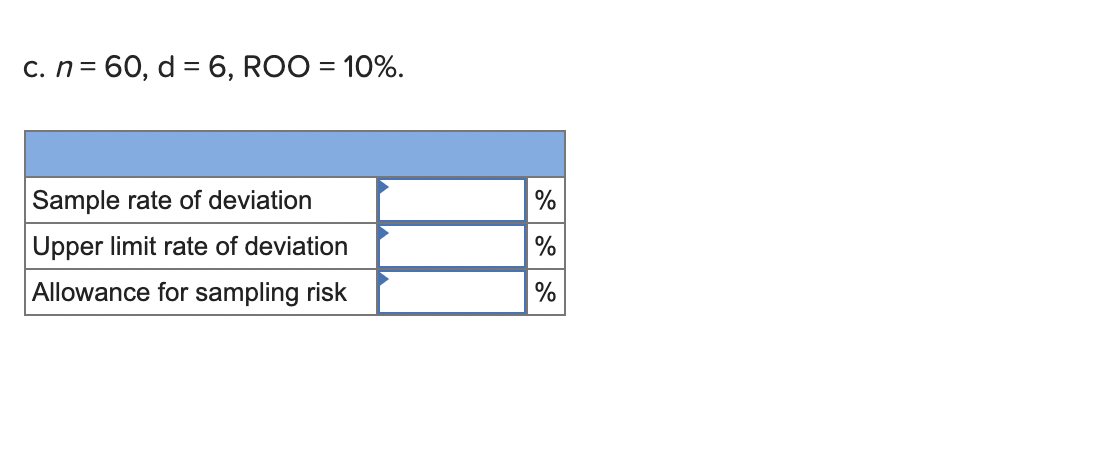
1.
Step by Step Solution
There are 3 Steps involved in it
1 Expert Approved Answer
Step: 1 Unlock

Question Has Been Solved by an Expert!
Get step-by-step solutions from verified subject matter experts
Step: 2 Unlock
Step: 3 Unlock