

Question: Based on the 2016 data, complete the information in the table below. Then perform the DuPont analysis using the information from the filled-out table. To
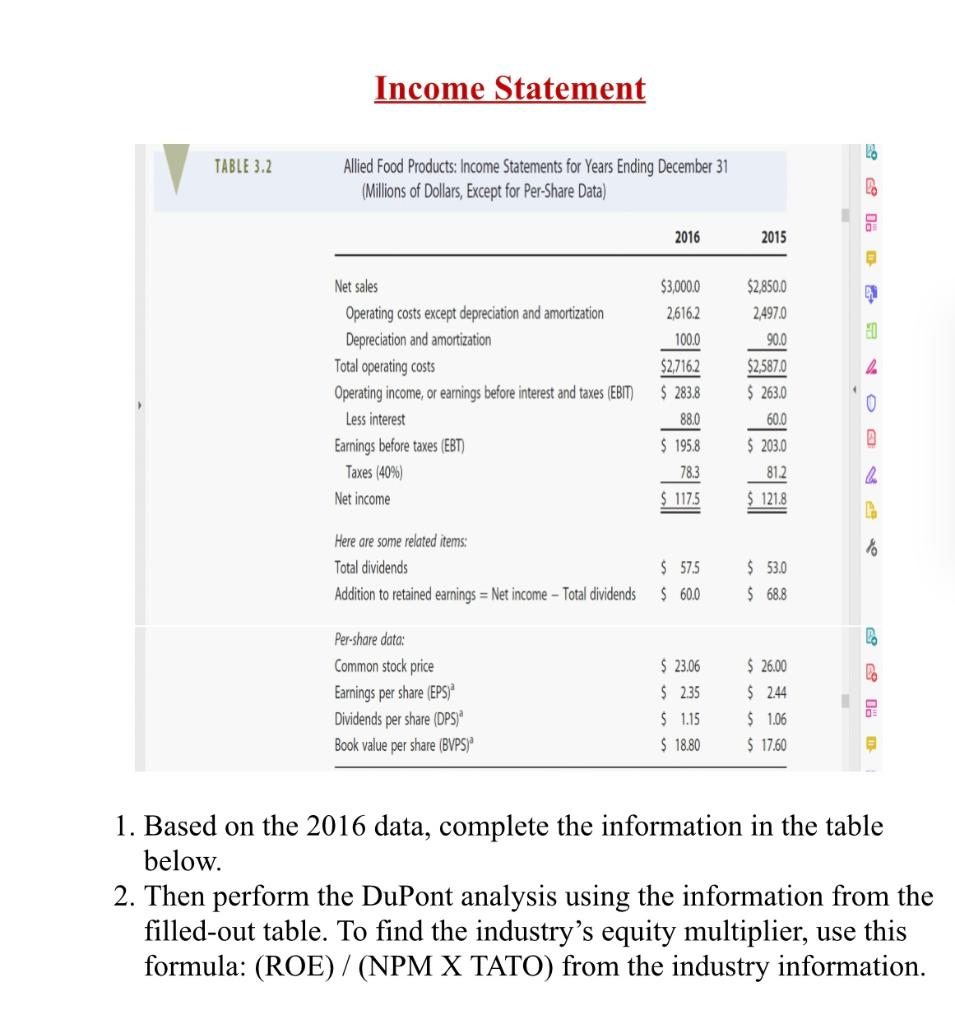
- Based on the 2016 data, complete the information in the table below.
- Then perform the DuPont analysis using the information from the filled-out table. To find the industrys equity multiplier, use this formula: (ROE) / (NPM X TATO) from the industry information.
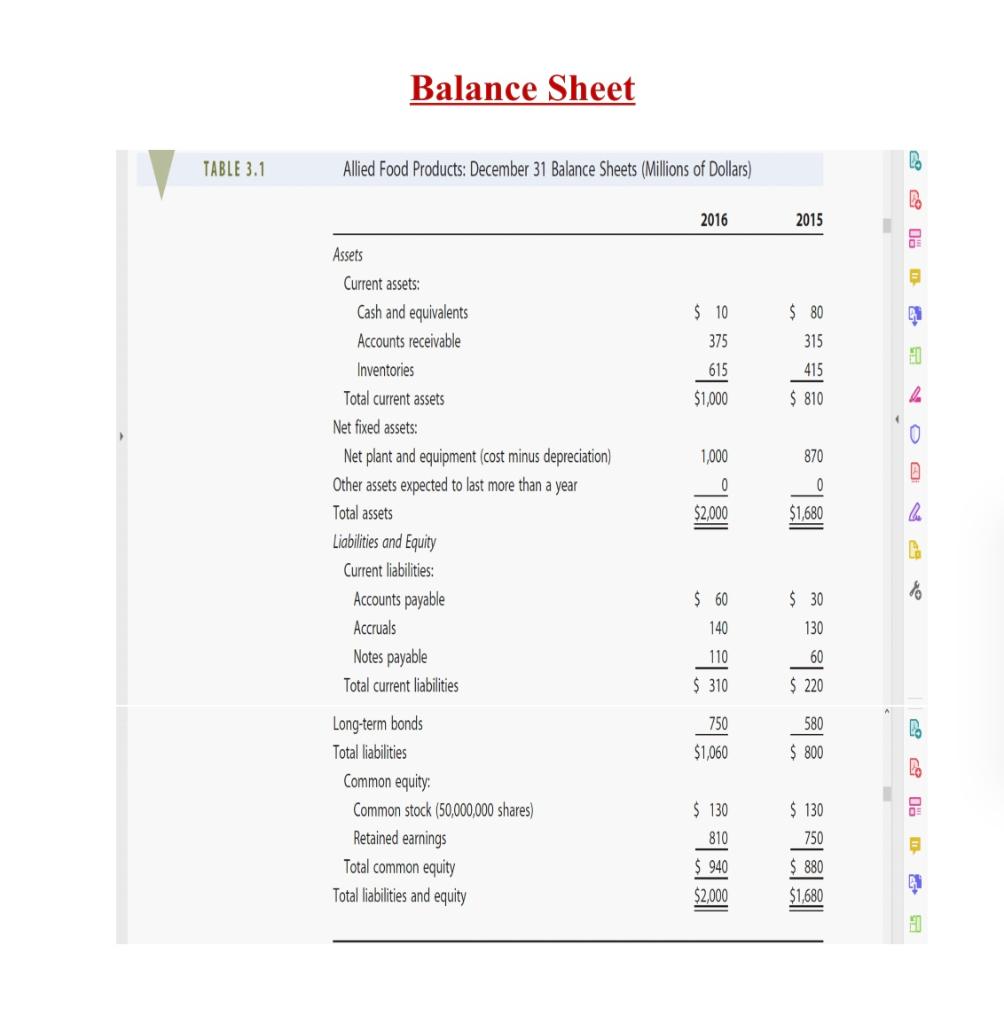
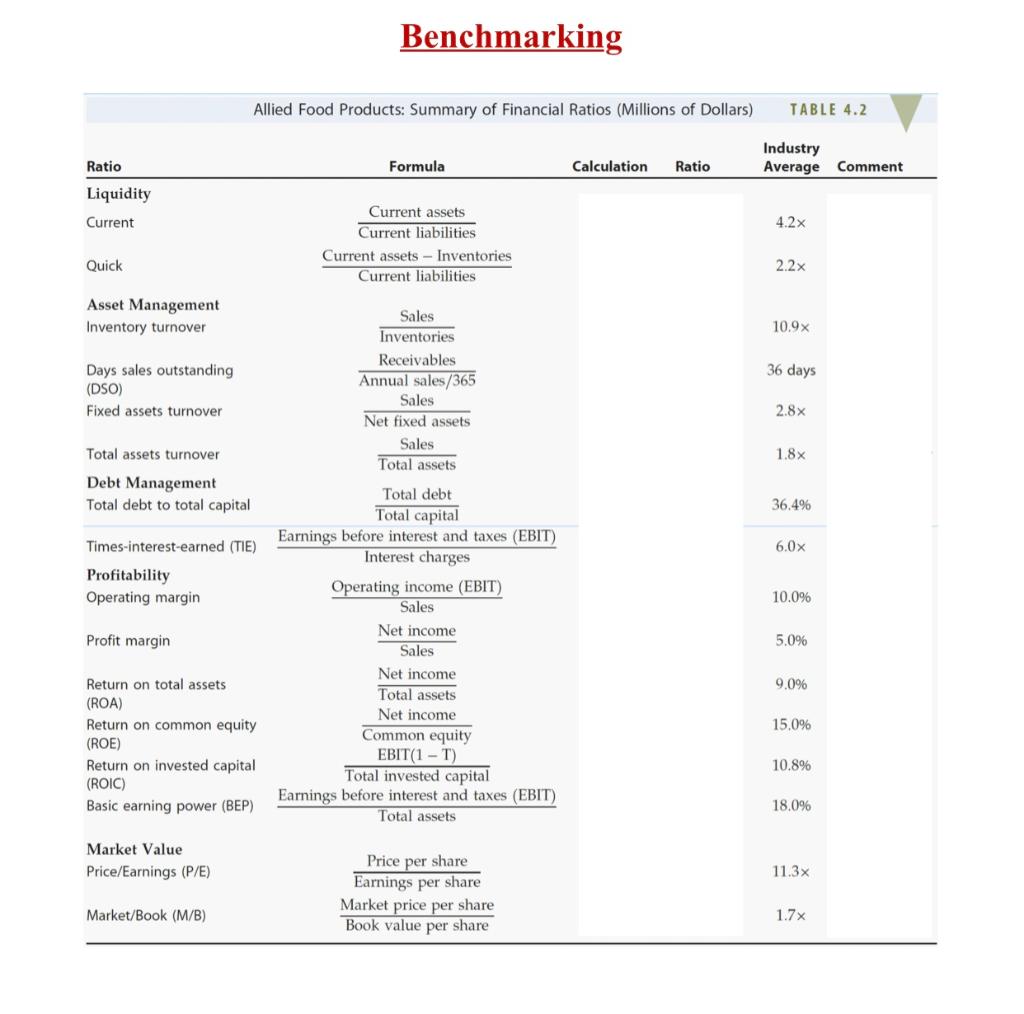
Balance Sheet TABLE 3.1 Allied Food Products: December 31 Balance Sheets (Millions of Dollars) 990 2016 2015 $ 10 $ 80 315 375 615 $1,000 415 $ 810 0 1,000 870 Assets Current assets: Cash and equivalents Accounts receivable Inventories Total current assets Net fixed assets: Net plant and equipment (cost minus depreciation) Other assets expected to last more than a year Total assets Liabilities and Equity Current liabilities: Accounts payable Accruals Notes payable Total current liabilities D 0 $2,000 0 $1,680 DO 18 $ 60 140 $ 30 130 60 110 $ 310 $ 220 DO 750 $1,060 580 $ 800 Long-term bonds Total liabilities Common equity Common stock (50,000,000 shares) Retained earnings Total common equity Total liabilities and equity $ 130 $ 130 810 $ 940 $2,000 750 $ 880 $1,680 Income Statement LO TABLE 3.2 Allied Food Products: Income Statements for Years Ending December 31 (Millions of Dollars, Except for Per-Share Data) DO 2016 2015 $2,850.0 HD Net sales Operating costs except depreciation and amortization Depreciation and amortization Total operating costs Operating income, or earnings before interest and taxes (EBIT) Less interest Earnings before taxes (EBT) Taxes (40%) Net income $3,000.0 26162 100.0 $2,7162 $ 2838 88.0 $ 1958 78.3 $ 1175 2,497.0 90.0 $2,587.0 $ 263.0 0 60.0 2 $ 203.0 81.2 $ 121.8 % Here are some related items: Total dividends Addition to retained earnings = Net income - Total dividends $ 57.5 $ 60.0 $ 53.0 $ 68.8 Per-share data: Common stock price Earnings per share (EPS) Dividends per share (DPS) Book value per share (BVPS) $ 23.06 $ 2.35 $ 1.15 $18.80 $ 26,00 $ 2.44 $ 1.06 $ 17.60 99 DS 1. Based on the 2016 data, complete the information in the table below. 2. Then perform the DuPont analysis using the information from the filled-out table. To find the industry's equity multiplier, use this formula: (ROE) / (NPM X TATO) from the industry information. Benchmarking Allied Food Products: Summary of Financial Ratios (Millions of Dollars) TABLE 4.2 Industry Average Comment Ratio Formula Calculation Ratio Liquidity Current 4.2x Current assets Current liabilities Current assets - Inventories Current liabilities Quick 2.2x Asset Management Inventory turnover 10.9x 36 days Days sales outstanding (DSO) Fixed assets turnover 2.8x Total assets turnover 1.8x Debt Management Total debt to total capital 36.4% Times-interest-earned (TIE) 6.0x Sales Inventories Receivables Annual sales/365 Sales Net fixed assets Sales Total assets Total debt Total capital Earnings before interest and taxes (EBIT) Interest charges Operating income (EBIT) Sales Net income Sales Net income Total assets Net income Common equity EBIT(1-T) Total invested capital Earnings before interest and taxes (EBIT) Total assets Profitability Operating margin 10.0% Profit margin 5.0% 9.0% 15.0% Return on total assets (ROA) Return on common equity (ROE) Return on invested capital (ROIC) Basic earning power (BEP) 10.8% 18.0% Market Value Price/Earnings (P/E) 11.3 Price per share Earnings per share Market price per share Book value per share Market/Book (M/B) 1.7x
Step by Step Solution
There are 3 Steps involved in it

Get step-by-step solutions from verified subject matter experts