

Question: 1. Below is the resulting concentration versus time graph from a pulse tracer test with Q=2 L/min and Mp,in=550 mg. 40 35 30 25 cplt)
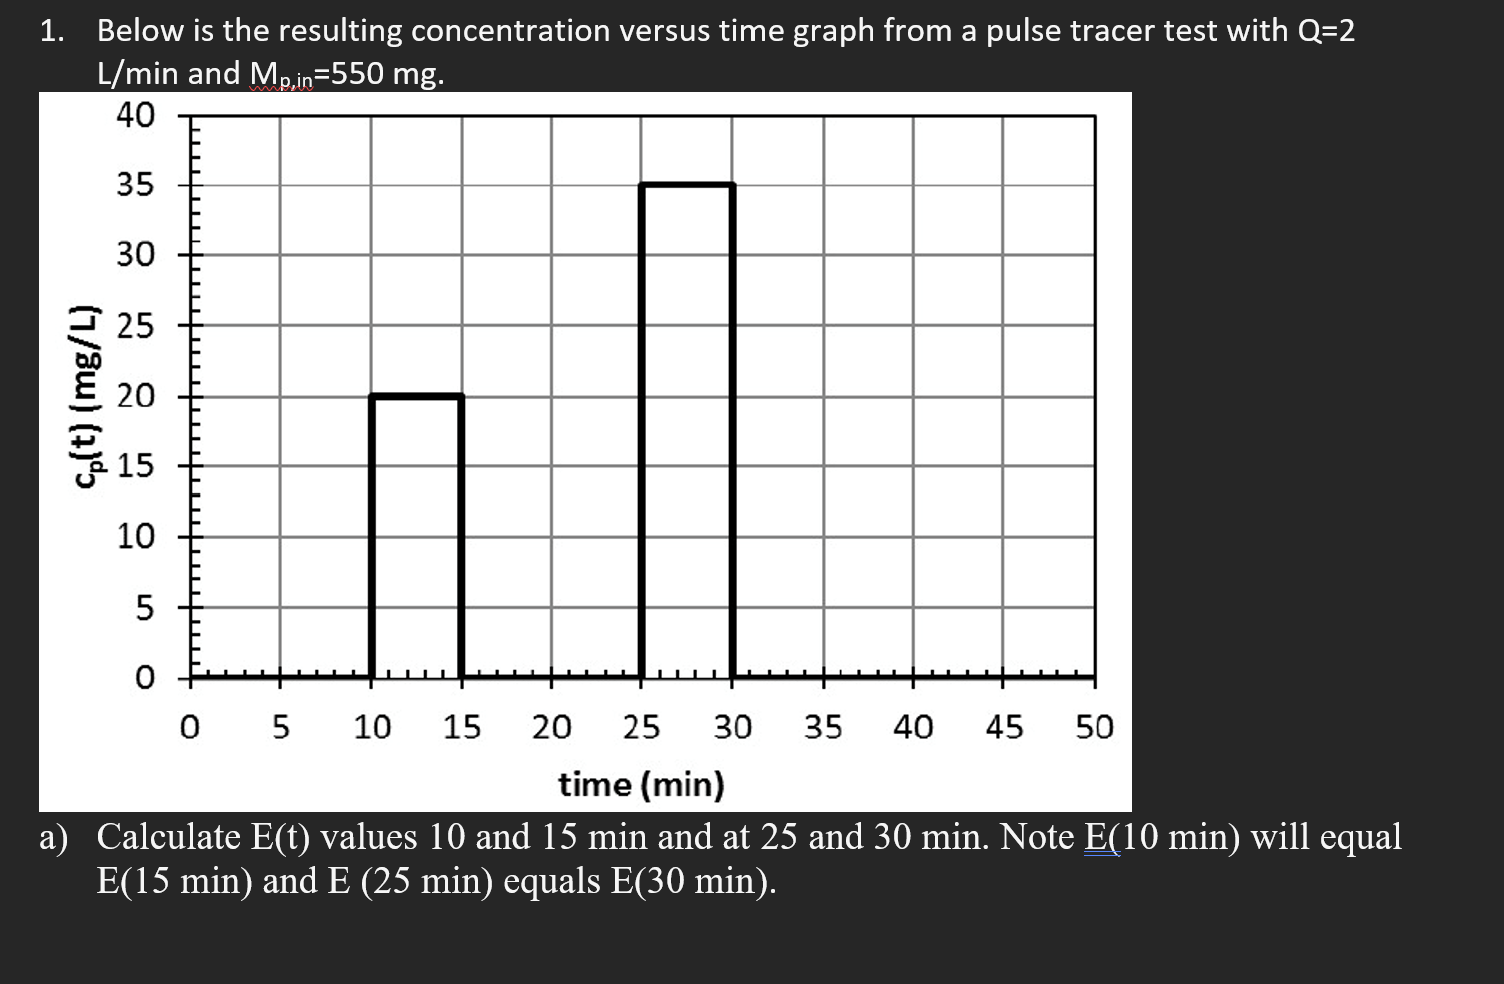
1. Below is the resulting concentration versus time graph from a pulse tracer test with Q=2 L/min and Mp,in=550 mg. 40 35 30 25 cplt) (mg/L) 20 15 10 5 O 0 5 10 15 20 25 30 35 40 45 50 time (min) a) Calculate Et) values 10 and 15 min and at 25 and 30 min. Note E(10 min) will equal E(15 min) and E (25 min) equals E(30 min)
Step by Step Solution
There are 3 Steps involved in it
1 Expert Approved Answer
Step: 1 Unlock

Question Has Been Solved by an Expert!
Get step-by-step solutions from verified subject matter experts
Step: 2 Unlock
Step: 3 Unlock