

Question: 1. Break-even analysis 1) In the space below, draw & label a graph showing the following: - X axis = Output, Y axis = Costs
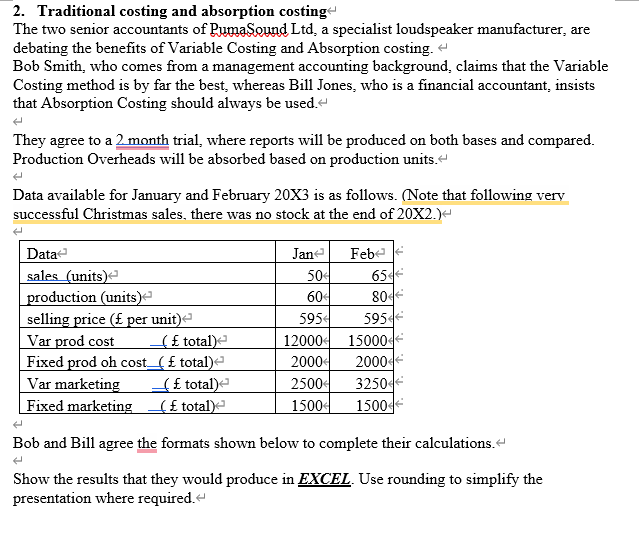
1. Break-even analysis 1) In the space below, draw \& label a graph showing the following: - X axis = Output, Y axis = Costs / Revenue - Fixed Costs - Total Costs - Total Revenue - Breakeven Point - Margin of safety - Profit 2) Total Cost = + 3) Contribution = 4) Breakeven = 5) Fixed costs =5,000 Variable Costs =80 Selling price per unit =100 Therefore, contribution per unit = Break-even point = = 6) Using the figures in Q5 if 300 are sold a. What is the 'margin of safety' in terms of units sold \& revenue? b. What profit would be made? 2. Traditional costing and absorption costing The two senior accountants of PumaSound Ltd, a specialist loudspeaker manufacturer, are debating the benefits of Variable Costing and Absorption costing. Bob Smith, who comes from a management accounting background, claims that the Variable Costing method is by far the best, whereas Bill Jones, who is a financial accountant, insists that Absorption Costing should always be used. They agree to a 2 month trial, where reports will be produced on both bases and compared. Production Overheads will be absorbed based on production units. Data available for January and February 20X3 is as follows. (Note that following very successful Christmas sales, there was no stock at the end of 20X2.) Bob and Bill agree the formats shown below to complete their calculations. Show the results that they would produce in EXCEL. Use rounding to simplify the presentation where required
Step by Step Solution
There are 3 Steps involved in it

Get step-by-step solutions from verified subject matter experts