

Question: 1. Complete the table below and calculate the percent passing for the sieve size ranges of - 250/+180 and -125/+90. Draw a histogram and cumulative
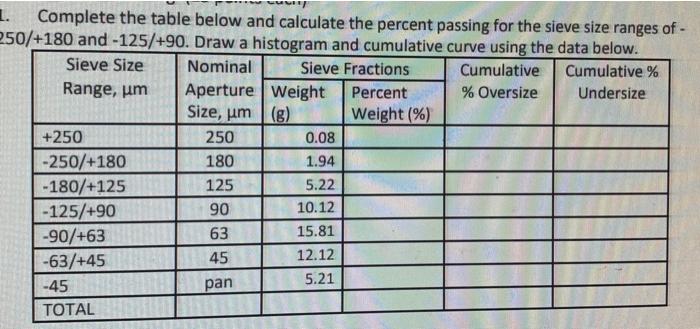
1. Complete the table below and calculate the percent passing for the sieve size ranges of - 250/+180 and -125/+90. Draw a histogram and cumulative curve using the data below. Sieve Size Nominal Sieve Fractions Cumulative Cumulative % Range, um Aperture Weight Percent % Oversize Undersize Size, um (8) Weight (%) +250 250 0.08 -250/+180 180 1.94 -180/+125 125 5.22 -125/+90 90 10.12 -90/+63 63 15.81 -63/+45 45 12.12 -45 pan 5.21 TOTAL
Step by Step Solution
There are 3 Steps involved in it
1 Expert Approved Answer
Step: 1 Unlock

Question Has Been Solved by an Expert!
Get step-by-step solutions from verified subject matter experts
Step: 2 Unlock
Step: 3 Unlock