

Question: 1. Computing labor productivity and its relationship to the demandfor labor Sizzler's produces charcoal grills in a small manufacturing facility and sells the grills in
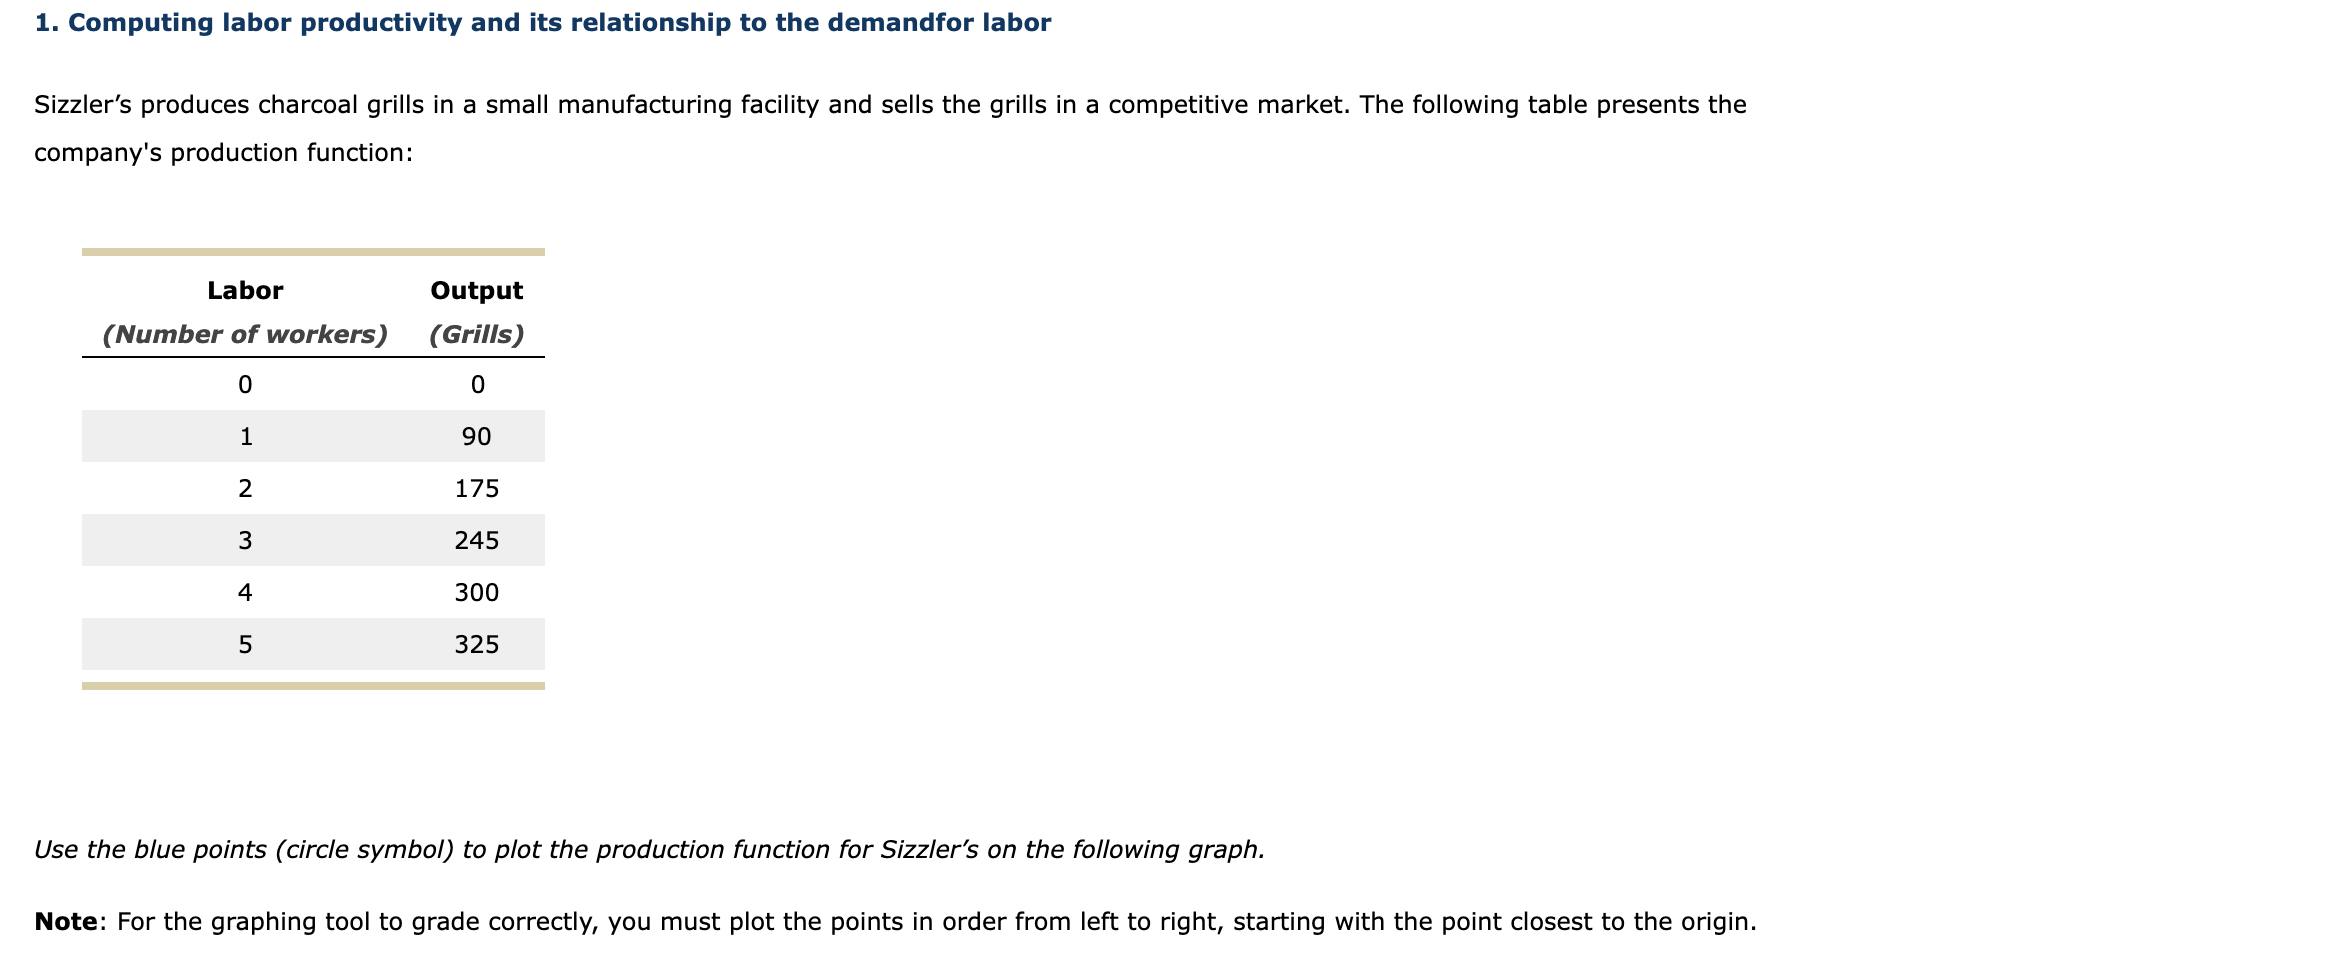
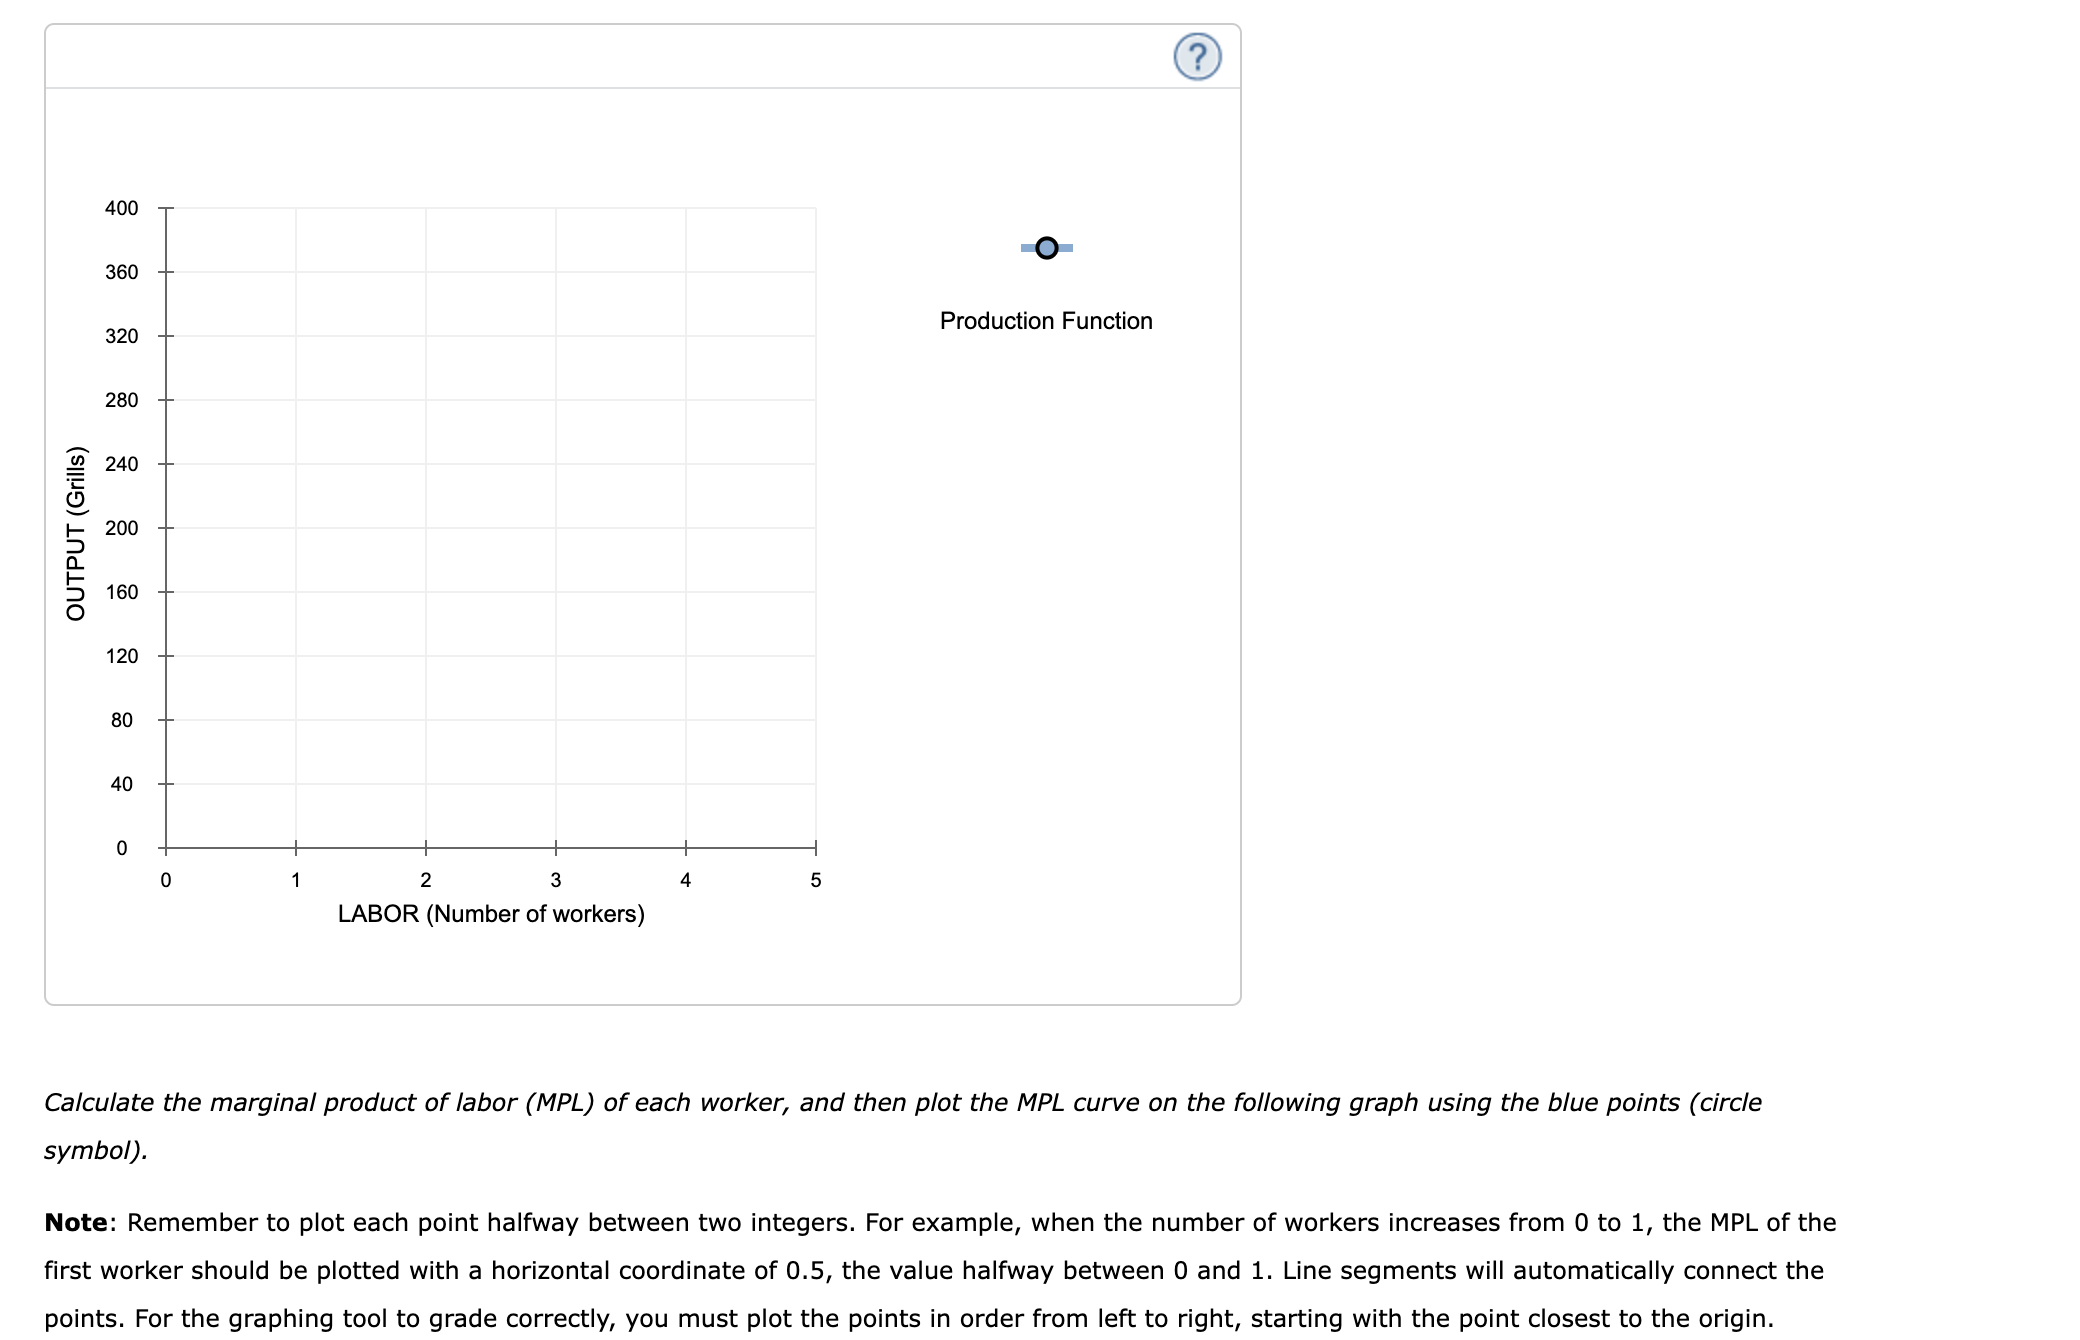


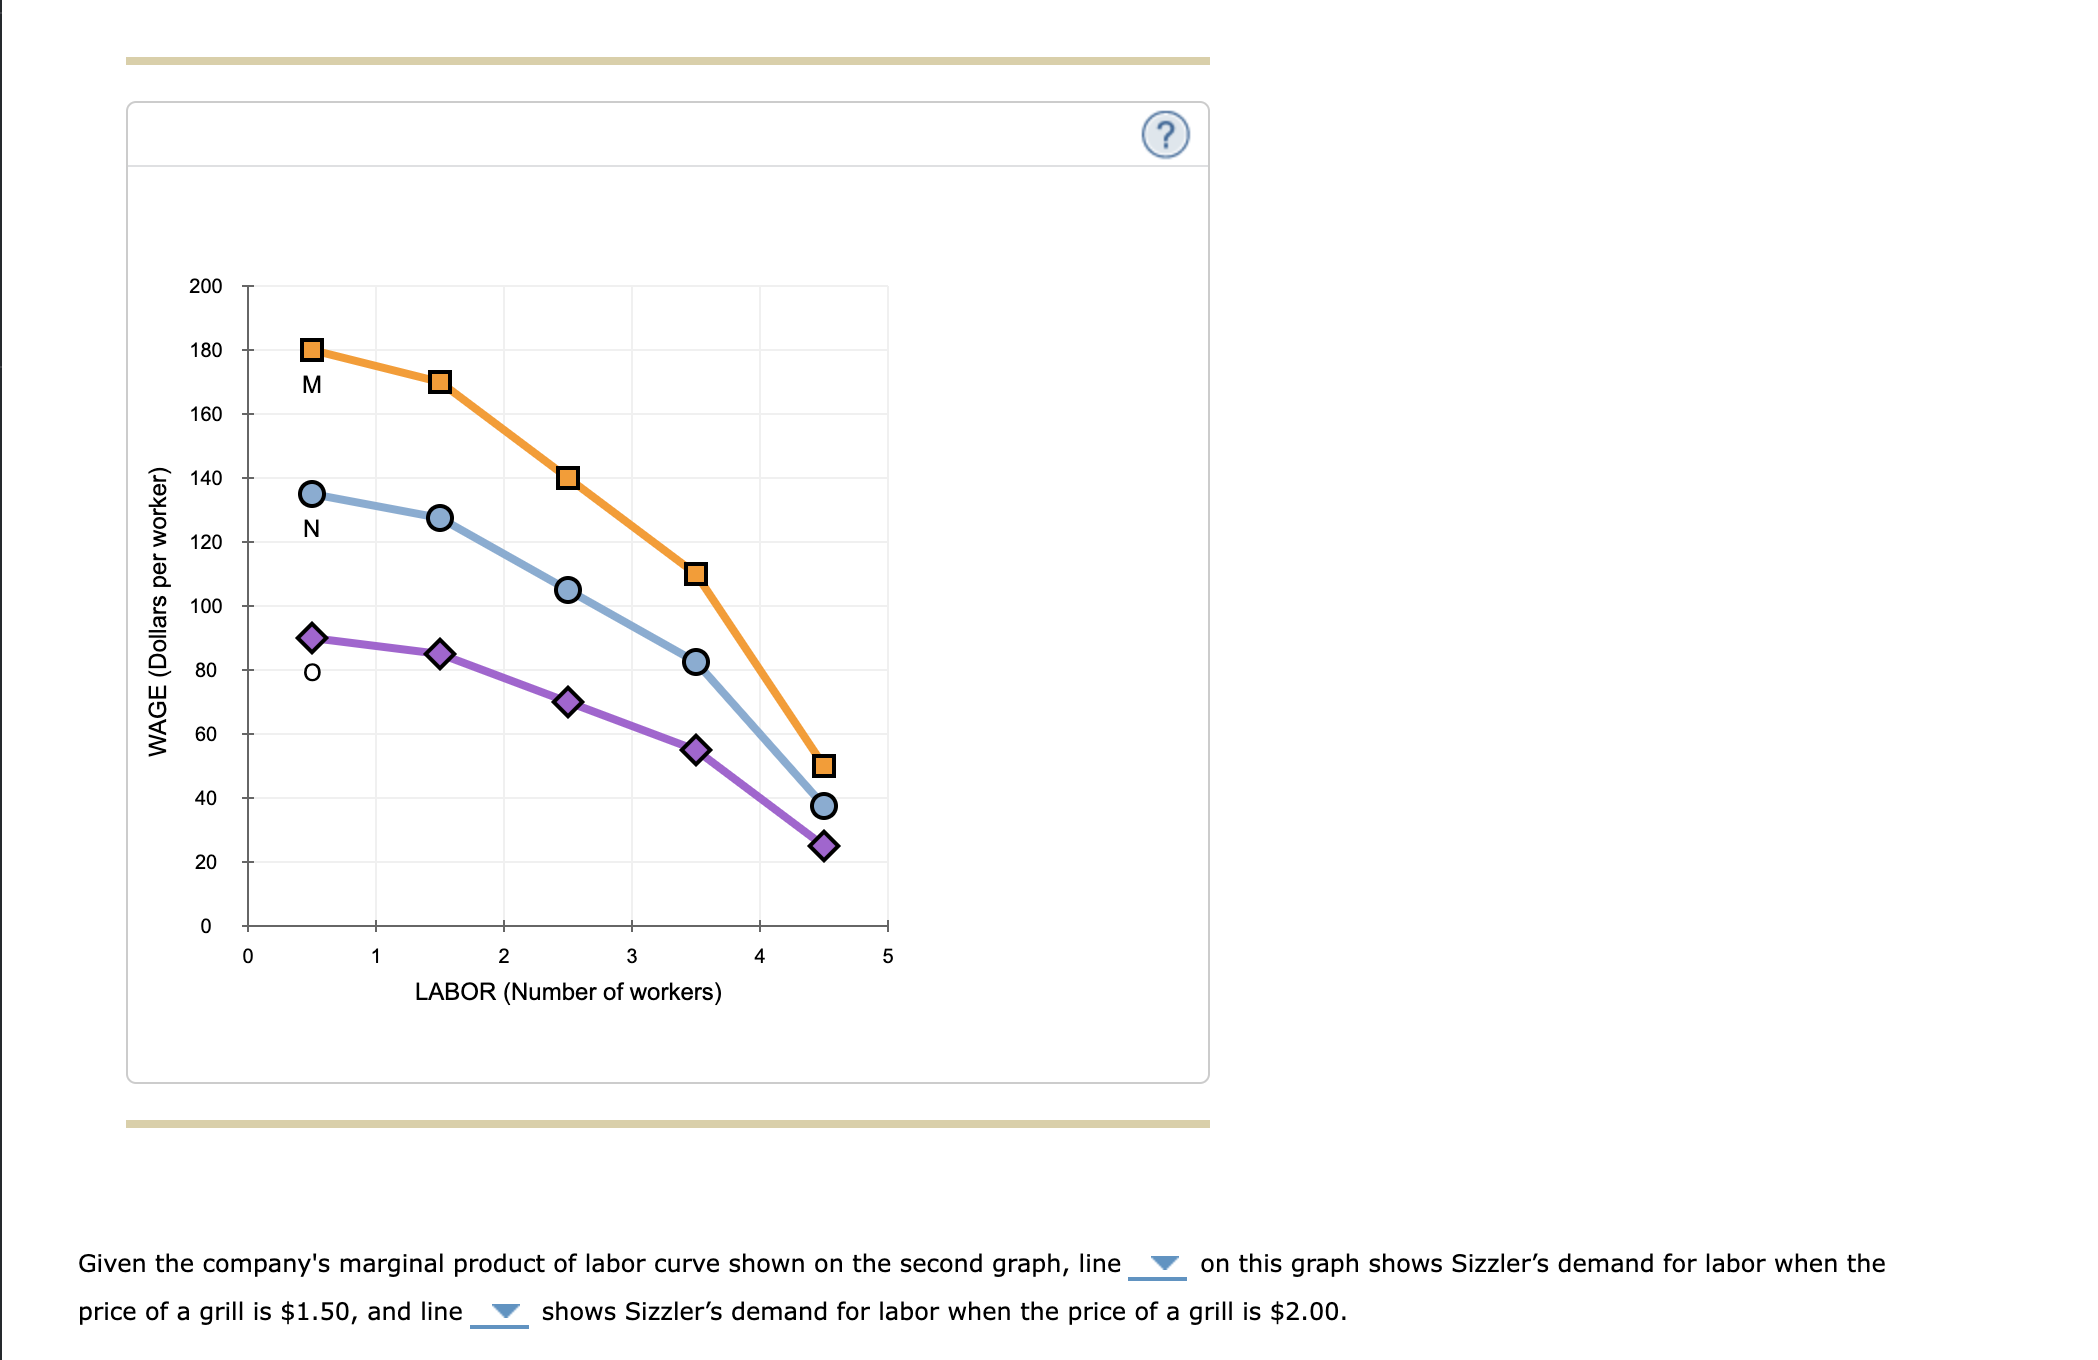
1. Computing labor productivity and its relationship to the demandfor labor Sizzler's produces charcoal grills in a small manufacturing facility and sells the grills in a competitive market. The following table presents the company's production function: Labor Output (Number of workers) (Grills) 0 0 1 90 2 175 3 245 4 300 S 325 Use the blue points (circle symbol) to plot the production function for Sizzler's on the following graph. Note: For the graphing tool to grade correctly, you must plot the points in order from left to right, starting with the point closest to the origin. / \\ :01] 400 O 360 320 Production Function 280 240 200 160 OUTPUT (Grills) 120 80 40 0 l l | 0 1 2 3 4 5 LABOR (Number of workers) Calculate the marginal product of labor (MPL) of each worker, and then plot the MPL curve on the following graph using the blue points (circle symbol). Note: Remember to plot each point halfway between two integers. For example, when the number of workers increases from O to 1, the MPL of the first worker should be plotted with a horizontal coordinate of 0.5, the value halfway between 0 and 1. Line segments will automatically connect the points. For the graphing tool to grade correctly, you must plot the points in order from left to right, starting with the point closest to the origin. 100 90 80 MPL 70 60 50 40 MPL (Grills per worker) 30 20 10 o 1 2 3 4 5 LABOR (Number of workers) The following graph shows the demand for labor for three different prices per grill: ? 200 180 M 160 140 ZO O 120 O 100 WAGE (Dollars per worker) O 80 60 40 20 0 1 2 3 4 LABOR (Number of workers) on this graph shows Sizzler's demand for labor when the Given the company's marginal product of labor curve shown on the second graph, line price of a grill is $1.50, and line _ shows Sizzler's demand for labor when the price of a grill is $2.00
Step by Step Solution
There are 3 Steps involved in it

Get step-by-step solutions from verified subject matter experts