

Question: 1. Consider the data displayed in the following table (one data set with 49 data points) 1.09 0.85 1.86 1.82 1.4 1.92 1.24 1.9
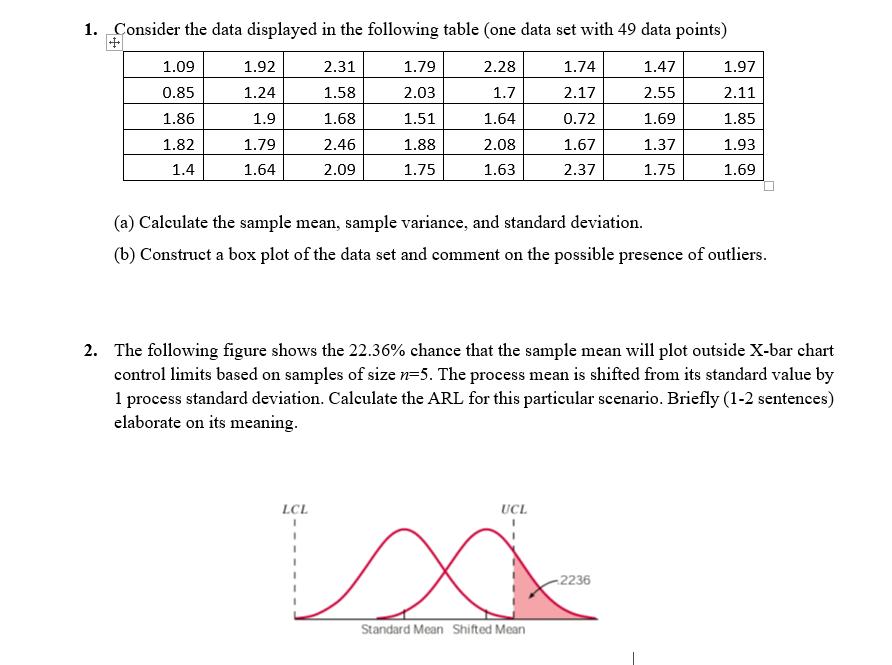
1. Consider the data displayed in the following table (one data set with 49 data points) 1.09 0.85 1.86 1.82 1.4 1.92 1.24 1.9 1.79 1.64 2.31 1.58 1.68 2.46 2.09 1.79 2.03 1.51 1.88 1.75 LCL 2.28 1.7 1.64 2.08 1.63 1.74 2.17 UCL 0.72 1.67 2.37 (a) Calculate the sample mean, sample variance, and standard deviation. (b) Construct a box plot of the data set and comment on the possible presence of outliers. x xx Standard Mean Shifted Mean 2. The following figure shows the 22.36% chance that the sample mean will plot outside X-bar chart control limits based on samples of size n=5. The process mean is shifted from its standard value by 1 process standard deviation. Calculate the ARL for this particular scenario. Briefly (1-2 sentences) elaborate on its meaning. 1.47 2.55 1.69 1.37 1.75 1.97 2.11 1.85 1.93 1.69 -2236
Step by Step Solution
3.42 Rating (180 Votes )
There are 3 Steps involved in it
1 Calculate the sample mean sample variance and standard deviation Sample mean To calculate the sample mean add up all the data points and divide by t... View full answer

Get step-by-step solutions from verified subject matter experts