

Question: 1. Consider the following data set. C l is years of education, C 2 is years of job experience, C 3 is age, and C
1. Consider the following data set. Cl is years of education, C2 is years of job experience, C3 is age, and C4 is annual salary.
a. Estimate the relationship:
C4 = a + b(Cl)+c(C2)+d(C3)
b. Test the hypothesis that the entire model (C1, C2, and C3 combined) does not explain a significant amount of variation in the dependent variable at the 5% level of significance.
c. What fraction of the variation in annual salary is explained by education, experience, and age?
d. Calculate a 90% Confidence Interval for expected income for a person with 12 years of education, 10 years of experience, and who is age 30.
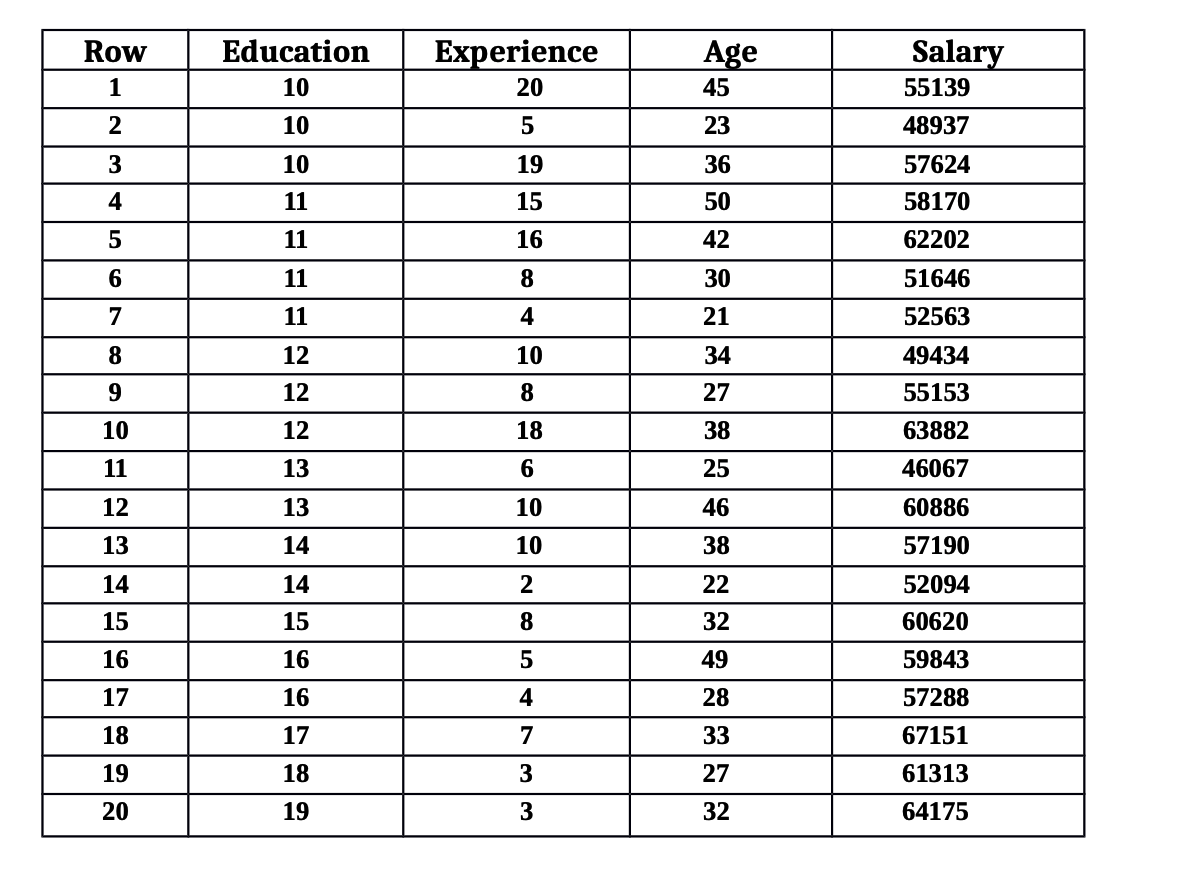
Row Education Experience Age Salary 1 10 20 45 55139 2 10 5 23 48937 3 10 19 36 57624 A 11 15 50 58170 11 16 42 62202 11 8 30 51646 11 A 21 52563 12 10 34 49434 12 8 27 55153 10 12 18 38 63882 11 13 6 25 46067 12 13 10 46 60886 13 14 10 38 57190 14 14 2 22 52094 15 15 8 32 60620 16 16 49 59843 17 16 A 28 57288 18 17 33 67151 19 18 3 27 61313 20 19 32 64175
Step by Step Solution
There are 3 Steps involved in it

Get step-by-step solutions from verified subject matter experts