

Question: 1. Construct the Cashflow Statement for 2021. 2. Calculate any TWO relevant financial ratios for each of the following areas to determine Top Glove's:
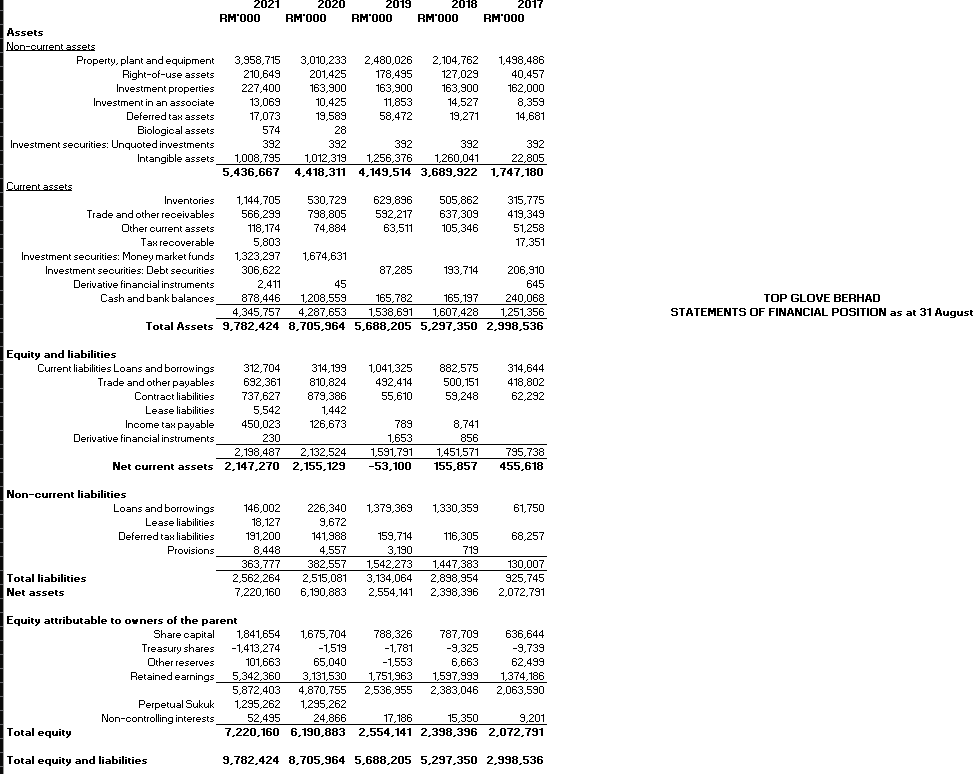
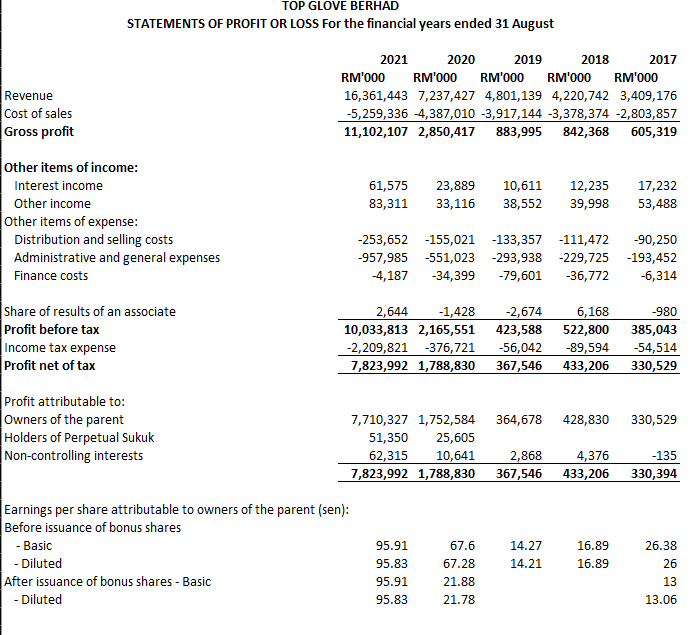
1. Construct the Cashflow Statement for 2021. 2. Calculate any TWO relevant financial ratios for each of the following areas to determine Top Glove's: a. Ability to meet maturing obligations. b. Effectiveness in managing assets and efficiency in handling operations. c. Profitability and overall operating results. d. Ability to service debts and defree of financial risk. 3. Use both the Statements of Profit and Lost and Statements of Financial Position to conduct a HORIZONTAL and VERTICAL ANALYSIS. From the results, identify (in percentage terms) which items that affect the firm's net profit the most and the composition of the firm's working capital over the five-year period. 4. From the ratios, horizontal and vertical analysis above, as well as information provided by the Cash Flow Statement, prepare a comprehensive financial report for Year 2021. Your discussion should include the firm's liquidity position, effectiveness in managing assets, the degree of financial risks and overall profitability results. 2021 2020 2019 2018 2017 RM'000 RM'000 RM'000 RM'000 RM'000 Assets Non-current assets Property, plant and equipment 3,958,715 3,010,233 2,480,026 2,104,762 1,498,486 Right-of-use assets 210,649 201,425 178,495 127,029 40,457 Investment properties Investment in an associate 227,400 163,900 163,900 163,900 162,000 13,069 10,425 11,853 14,527 8,359 Deferred tax assets 17,073 19,589 58,472 19,271 14,681 Biological assets 574 28 Investment securities: Unquoted investments Intangible assets 392 1,008,795 5,436,667 392 1,012,319 4,418,311 392 392 392 1,256,376 1,260,041 4,149,514 3,689,922 1,747,180 22,805 Current assets Inventories 1,144,705 Trade and other receivables 566,299 Other current assets Tax recoverable Investment securities: Money market funds Investment securities: Debt securities Derivative financial instruments Cash and bank balances 118,174 5,803 1,323,297 306,622 2,411 878,446 4,345,757 530,729 798,805 74,884 629,896 505,862 315,775 592,217 637,309 419,349 63,511 105,346 51,258 17,351 1,674,631 87,285 206,910 45 645 1,208,559 165,782 165,197 240,068 4,287,653 1,538,691 1,607,428 1,251,356 193,714 Total Assets 9,782,424 8,705,964 5,688,205 5,297,350 2,998,536 Equity and liabilities Current liabilities Loans and borrowings 312,704 Trade and other payables 692,361 Contract liabilities 737,627 314,199 1,041,325 882,575 810,824 492,414 879,386 314,644 55,610 500,151 59,248 418,802 62,292 Lease liabilities Income tax payable 5,542 Derivative financial instruments 450,023 230 1,442 126,673 789 1,653 2,198,487 Net current assets 2,147,270 2,132,524 2,155,129 1,591,791 -53,100 8,741 856 1,451,571 795,738 155,857 455,618 Non-current liabilities Loans and borrowings Lease liabilities Deferred tax liabilities Provisions Total liabilities Net assets 146,002 18,127 191,200 8,448 363,777 2,562,264 7,220,160 226,340 9,672 141,988 159,714 116,305 4,557 3,190 719 382,557 1,542,273 1,447,383 2,515,081 3,134,064 2,898,954 6,190,883 2,554,141 2,398,396 1,379,369 1,330,359 61,750 68,257 130,007 925,745 2,072,791 Equity attributable to owners of the parent Other reserves Retained earnings Share capital Treasury shares -1,413,274 101,663 5,342,360 1,841,654 5,872,403 Perpetual Sukuk Non-controlling interests 1,295,262 1,675,704 -1,519 65,040 3,131,530 4,870,755 1,295,262 788,326 787,709 -1,781 -9,325 -1,553 6,663 1,751,963 1,597,999 1,374,186 2,536,955 2,383,046 2,063,590 636,644 -9,739 62,499 Total equity Total equity and liabilities 52,495 7,220,160 24,866 17,186 15,350 9,201 6,190,883 2,554,141 2,398,396 2,072,791 9,782,424 8,705,964 5,688,205 5,297,350 2,998,536 TOP GLOVE BERHAD STATEMENTS OF FINANCIAL POSITION as at 31 August TOP GLOVE BERHAD STATEMENTS OF PROFIT OR LOSS For the financial years ended 31 August Revenue Cost of sales Gross profit Other items of income: 2021 RM'000 2020 2019 2018 2017 RM'000 RM'000 RM'000 RM'000 16,361,443 7,237,427 4,801,139 4,220,742 3,409,176 -5,259,336 -4,387,010 -3,917,144 -3,378,374 -2,803,857 11,102,107 2,850,417 883,995 842,368 605,319 61,575 23,889 10,611 12,235 17,232 83,311 33,116 38,552 39,998 53,488 Interest income Other income Other items of expense: Distribution and selling costs Administrative and general expenses Finance costs Share of results of an associate Profit before tax Income tax expense Profit net of tax Profit attributable to: -957,985 Owners of the parent Holders of Perpetual Sukuk Non-controlling interests -4,187 -253,652 -155,021 -133,357 -111,472 -551,023 -293,938 -229,725 -34,399 -79,601 -36,772 -90,250 -193,452 -6,314 2,644 -1,428 10,033,813 2,165,551 -2,674 6,168 -980 423,588 522,800 385,043 -2,209,821 -376,721 7,823,992 1,788,830 -56,042 -89,594 -54,514 367,546 433,206 330,529 Earnings per share attributable to owners of the parent (sen): Before issuance of bonus shares - Basic - Diluted After issuance of bonus shares - Basic - Diluted 7,710,327 1,752,584 364,678 428,830 330,529 51,350 25,605 62,315 7,823,992 1,788,830 10,641 2,868 367,546 4,376 -135 433,206 330,394 95.91 67.6 14.27 16.89 26.38 95.83 67.28 14.21 16.89 26 95.91 21.88 13 95.83 21.78 13.06
Step by Step Solution
There are 3 Steps involved in it

Get step-by-step solutions from verified subject matter experts