

Question: 1. Create a projected profits worksheet using the Excel file template available in your D2L course. To download the file, select the Content tab, then
1. Create a projected profits worksheet using the Excel file template available in your D2L course. To download the file, select the Content tab, then click on Table of Contents, then Excel Assignments, then Excel Assignment 1. Then select the down arrow to the right of Excel Assignment 1 Template and download the file. You should watch the assignment 1 tutorials before attempting this assignment.
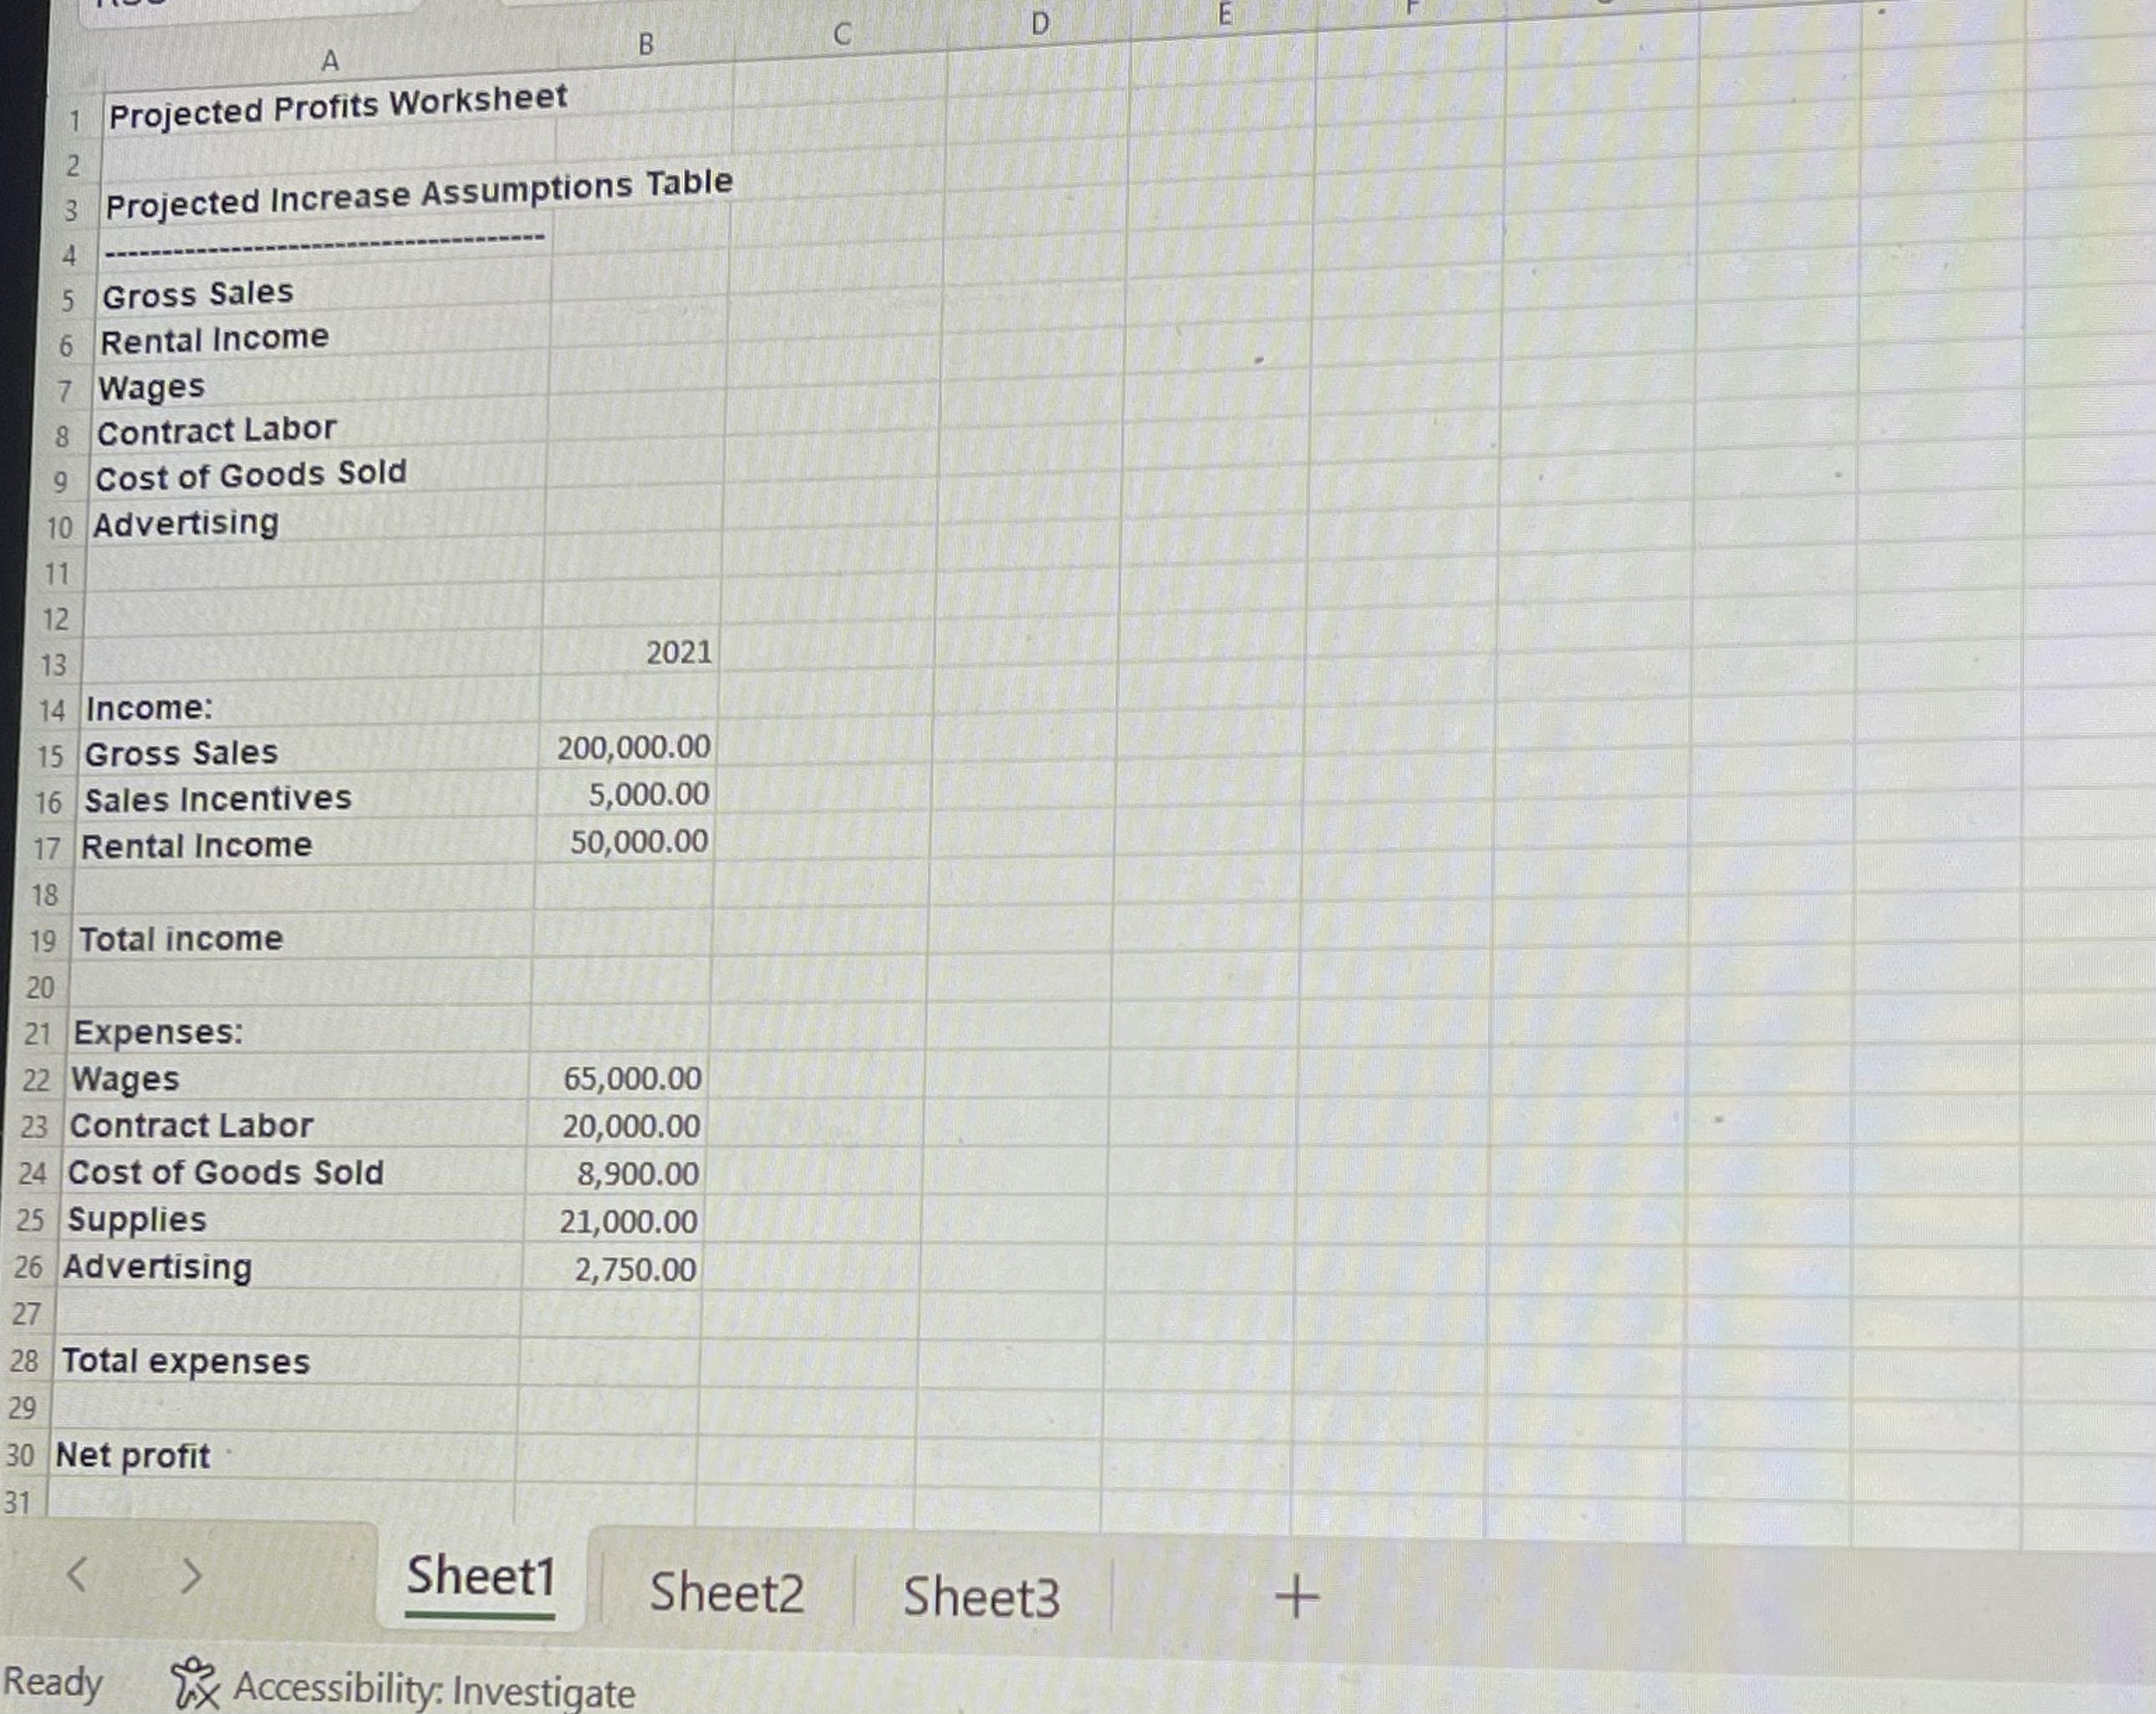
2. Bold all text in column A.
3. Under the Projected Increase Assumptions table enter the following percentages in column B next to each category and format as percent with 1 decimal place:
10% for Gross Sales
3% for Rental Income
2% for Wages
2% for Contract Labor
1% for Cost of Goods Sold
2% for Advertising
4. This Projected Profits worksheet covers a 6 year period so in cell C13 enter the year 2022. Then copy cells B13 and C13 to cells D13, E13, F13, and G13, respectively. Use what you learned in the Excel tutorials, so you end up with the years 2021 2026 as column headings in row 13.
5. In cell B19, B28, and B30 respectively, calculate Total Income, Total Expenses, and Net Profit (use the sum function for Total Income and Total Expenses). Format all three as currency with 2 decimal places
6. Gross Sales are predicted to increase by 10% per year for the next 4 years. In cell C15 calculate projected Gross Sales. Use absolute cell referencing and the percentage Gross Sales increase from the Assumptions Table to calculate the projected Gross Sales for 2022. Do not use the actual percentage (10%) in the formula. Instead use the cell address where the Gross Sales Increase is stored in the table. Then copy the formula to the remaining year columns. Adjust column widths as necessary to properly display data.
7. Sales incentives are not expected to increase so just copy the 5,000 in cell B16 to the remaining year columns.
8. Similar to what you did in #6 above, calculate projected Rental Income, Wages, Contract Labor, Cost of Goods Sold, and Advertising for the years 2022, 2023, 2024, 2025, and 2026. Use absolute cell referencing and percent increase from the Assumptions Table. Use the cell address from the table, not the actual percentage in the formula.
9. Supplies are not expected to increase so just copy the 2021 numbers to the remaining year columns.
10. Copy the formulas for Total Income, Total Expenses, and Net Profit to the columns for the years 2022, 2023, 2024, 2025 and 2026.
11. Format all dollar values as number with 2 decimal places except for those already formatted in #5 above. 12. Create a line chart that graphs Total Income, Total Expenses, and Net Profit for the years 2021 2026. Place the chart just below the Net Profit row. Add a chart title Projected Profits and make sure the legend correctly identifies the chart lines as Total Income, Total Expenses, and Net Profit. Make sure the horizontal axis labels display years correctly.
Ready 2 x Accessibility: Investigate
Step by Step Solution
There are 3 Steps involved in it

Get step-by-step solutions from verified subject matter experts