

Question: 1) Define a library mylib to your data folder 2) Use PROC IMPORT procedure to import class_info. csv Name the output file class_sum and store
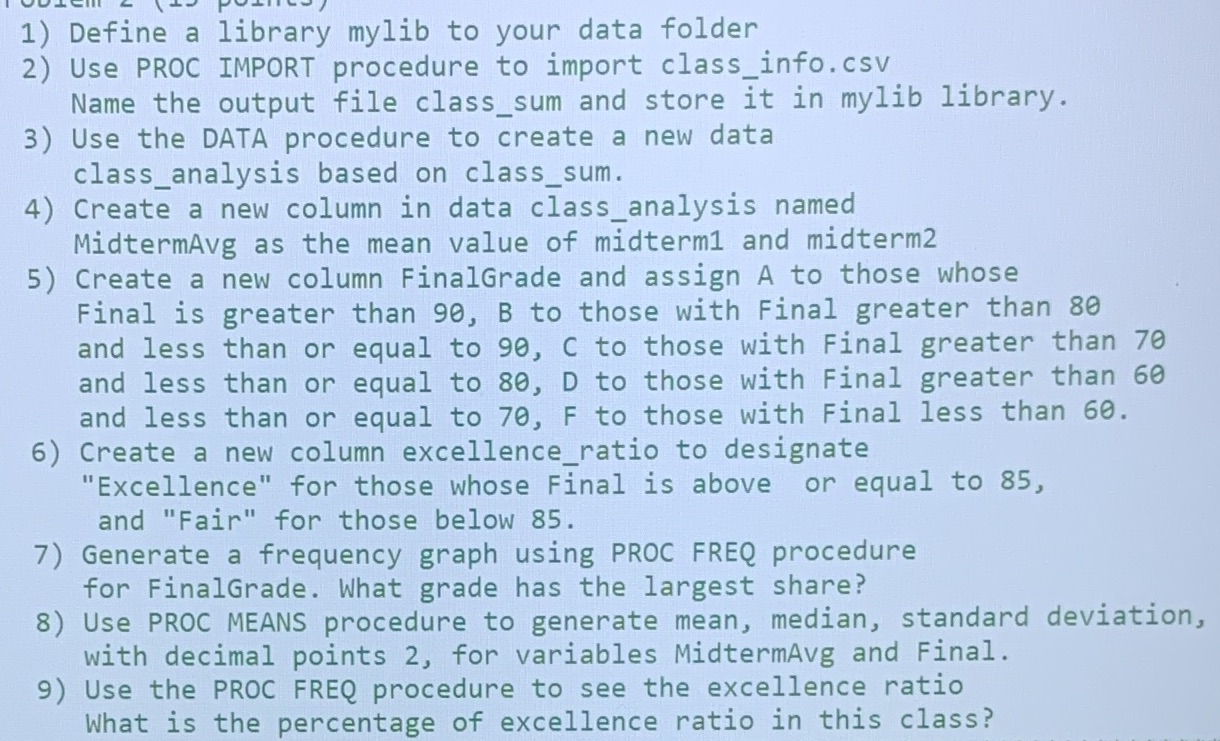
1) Define a library mylib to your data folder 2) Use PROC IMPORT procedure to import class_info. csv Name the output file class_sum and store it in mylib library. 3) Use the DATA procedure to create a new data class_analysis based on class_sum. 4) Create a new column in data class_analysis named MidtermAvg as the mean value of midterm1 and midterm2 5) Create a new column FinalGrade and assign A to those whose Final is greater than 90, B to those with Final greater than 80 and less than or equal to 90, C to those with Final greater than 70 and less than or equal to 80, D to those with Final greater than 60 and less than or equal to 70, F to those with Final less than 60. 6) Create a new column excellence_ratio to designate "Excellence" for those whose Final is above or equal to 85, and "Fair" for those below 85. 7) Generate a frequency graph using PROC FREQ procedure for FinalGrade. What grade has the largest share? 8) Use PROC MEANS procedure to generate mean, median, standard deviation, with decimal points 2, for variables MidtermAvg and Final. 9) Use the PROC FREQ procedure to see the excellence ratio What is the percentage of excellence ratio in this class
Step by Step Solution
There are 3 Steps involved in it

Get step-by-step solutions from verified subject matter experts