

Question: 1.) Deseasonalize the data using a Multiplicative model with a 0.5 weighted moving average. Produce a time series plot of the deseasonalized data and add
1.) Deseasonalize the data using a Multiplicative model with a 0.5 weighted moving average. Produce a time series plot of the deseasonalized data and add a trendline. A regression output is also expected here.
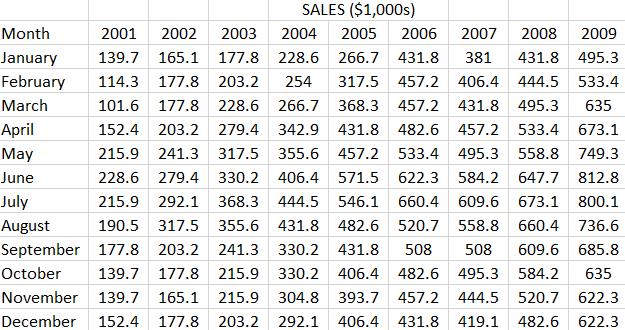
SALES ($1,000s) Month 2001 2002 2003 January February 114.3 2004 2005 2006 2007 2008 2009 139.7 165.1 177.8 228.6 266.7 431.8 381 431.8 495.3 177.8 203.2 254 317.5 457.2 406.4 266.7 368.3 457.2 431.8 495.3 279.4 342.9 431.8 482.6 457.2 533.4 444.5 533.4 March 101.6 177.8 228.6 635 April 152.4 203.2 673.1 May 215.9 241.3 317.5 355.6 457.2 533.4 495.3 558.8 749.3 June 647.7 812.8 July 444.5 800.1 August 736.6 228.6 279.4 330.2 406.4 571.5 622.3 584.2 215.9 292.1 368.3 546.1 660.4 609.6 673.1 190.5 317.5 355.6 431.8 482.6 520.7 558.8 660.4 September 177.8 203.2 241.3 330.2 431.8 508 508 609.6 October 139.7 177.8 215.9 330.2 406.4 482.6 495.3 584.2 November 139.7 165.1 215.9 304.8 393.7 457.2 444.5 520.7 December 152.4 177.8 203.2 292.1 685.8 635 622.3 406.4 431.8 419.1 482.6 622.3
Step by Step Solution
3.38 Rating (170 Votes )
There are 3 Steps involved in it
Deseasonalized Data and Trend Analysis Step 1 Deseasonalizing Multiplicative Model Applied a 12month ... View full answer

Get step-by-step solutions from verified subject matter experts