

Question: 1. Develop a seasonally adjusted forecast model for seat occupancy. Forecast seat occupancy for year 6 by using a linear trend line forecast estimate for
1. Develop a seasonally adjusted forecast model for seat occupancy. Forecast seat occupancy for year 6 by using a linear trend line forecast estimate for seat occupancy in year 6. 2. Develop linear regression models relating seat occupancy to discount fares to forecast seat occupancy for each quarter in year 6. Assume a fare discount of 20% for quarter 1, 36% for quarter 2, 25% for quarter 3, and 30% for quarter 4. Which is better forecast, 1 or 2?
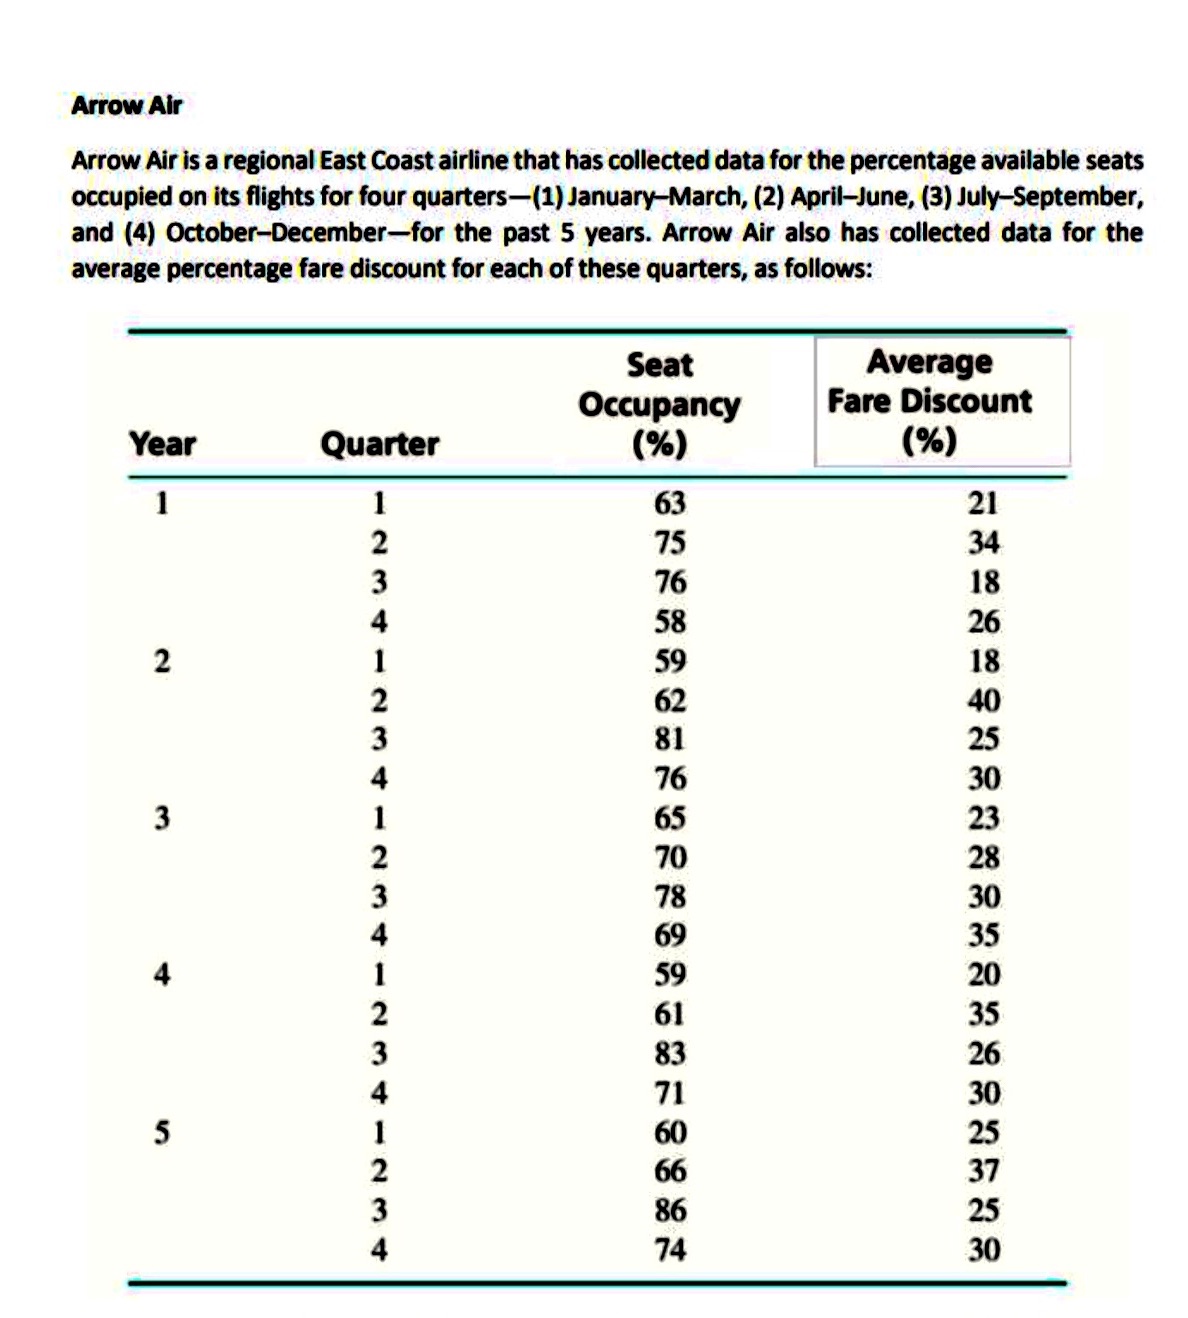
Arrow Air Arrow Air is a regional East Coast airline that has collected data for the percentage available seats occupied on its flights for four quarters-(1) January-March, (2) April-June, (3) July-September, and (4) October-December-for the past 5 years. Arrow Air also has collected data for the average percentage fare discount for each of these quarters, as follows: Seat Average Occupancy Fare Discount Year Quarter (%) (%) 1 63 21 75 34 76 18 26 2 18 40 25 w A W N - A W N - A W N - A W N- AWN- 37 25 74 30
Step by Step Solution
There are 3 Steps involved in it

Get step-by-step solutions from verified subject matter experts