

Question: 1. Do the original data appear stationary? Is there a significant trend to the data? 2. Can you interpret the autocorrelations as dying down? If
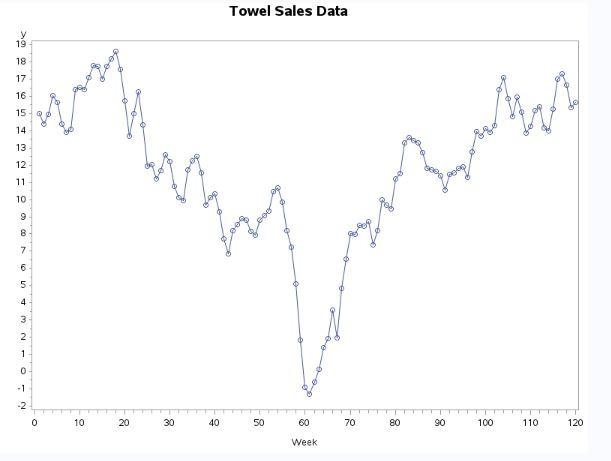
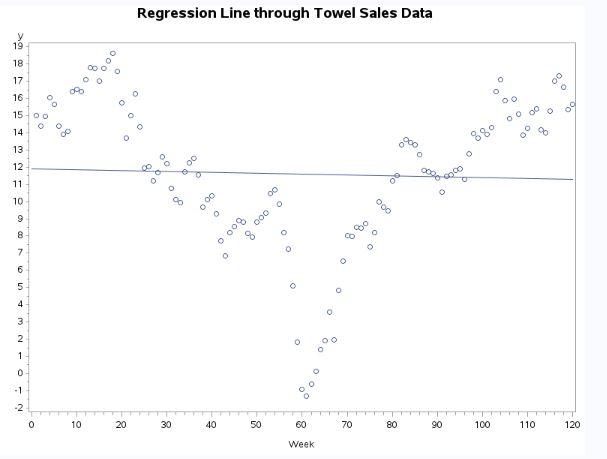
1. Do the original data appear stationary? Is there a significant trend to the data?
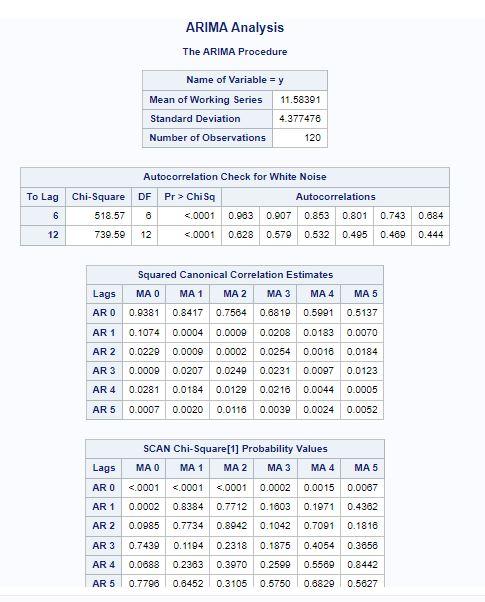
2. Can you interpret the autocorrelations as dying down? If so, then a stationary model may be possible.
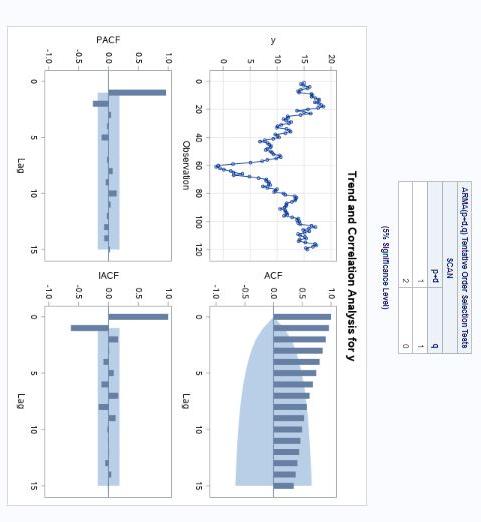
3. Do the models suggested by the scan option appear to be consistent to what the autocorrelation and partial autocorrelation functions are suggesting?
Need help with interpretation of results from SAS coding assignments, results are shown for ques 1,2,3
y 19 18 17 16 5 15- Q 14 8 = N WE 13 12 11 10 9 8 7 6 5 4 3 2 1 0 -1 -2 N- 0 10 20 30 30 40 Towel Sales Data 50 60 Week 70 80 90 Mar 100 110 120 19 18 17 16 1500 O 14 13 12 11 10 6: 8 7 1650 4 3 -ON W 2 1 0 -1 -2 00 0 10 000 000 20 Regression Line through Towel Sales Data 0 & 00 'o 0 30 8 00 000 O 40 O 0.008 00 0 000 8 50 o O O 60 Week o 00 O O 70 000 00 90 80 0.000 90 400 100 00. 0.000 00 8 110 % O % 120 To Lag 6 12 Chi-Square DF 518.57 6 739.59 12 Lags AR 0 AR 1 AR 2 AR 3 AR 4 AR 5 Lags AR 0 AR 1 AR 2 AR 3 AR 4 AR 5 ARIMA Analysis The ARIMA Procedure Name of Variable = y Mean of Working Series Standard Deviation Number of Observations 11.58391 4.377476 120 Autocorrelation Check for White Noise Pr> Chi Sq 0.963 0.907 0.853 0.801 0.743 <.0001 autocorrelations squared canonical correlation estimates ma scan chi-square probability values pace observation. arma tentative order selection teate lag trend and analysis for y p significance level acf iacf q n we n- towel sales data week mar o w regression line through to df lags ar arima the procedure name of variable="y" mean working series standard deviation number observations autocorrelation check white noise pr> Chi Sq 0.963 0.907 0.853 0.801 0.743 <.0001 autocorrelations squared canonical correlation estimates ma scan chi-square probability values pace observation. arma tentative order selection teate lag trend and analysis for y p significance level acf iacf>Step by Step Solution
There are 3 Steps involved in it
1 Expert Approved Answer
Step: 1 Unlock

Question Has Been Solved by an Expert!
Get step-by-step solutions from verified subject matter experts
Step: 2 Unlock
Step: 3 Unlock