

Question: 1) Explain the graph we received in the simulation that shows the relationship between the received (throughput) and sent (load) packets. Why does the throughput
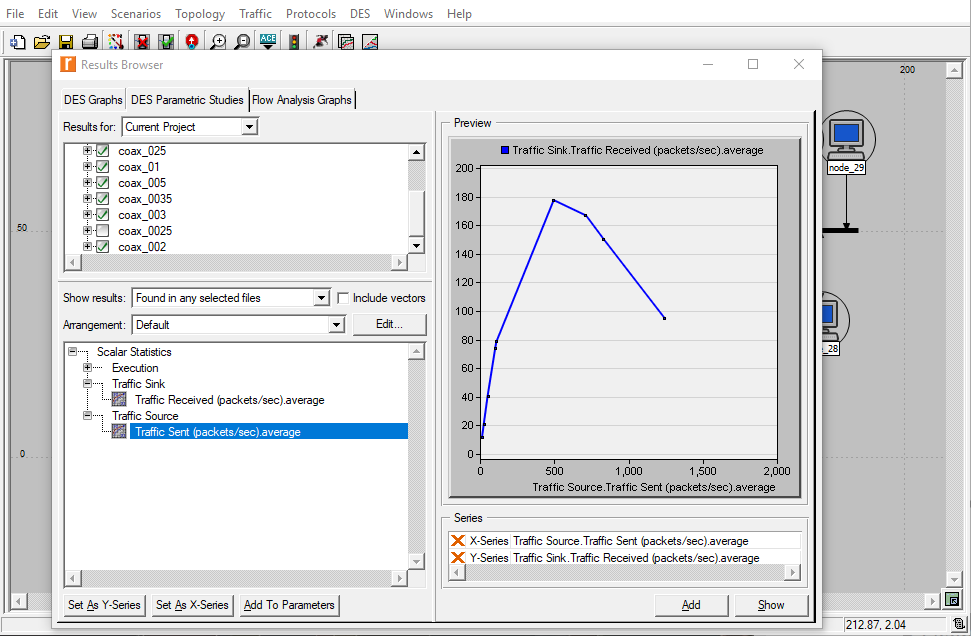
1) Explain the graph we received in the simulation that shows the relationship between the received (throughput) and sent (load) packets. Why does the throughput drop when the load is either very low or very high
Step by Step Solution
There are 3 Steps involved in it
1 Expert Approved Answer
Step: 1 Unlock

Question Has Been Solved by an Expert!
Get step-by-step solutions from verified subject matter experts
Step: 2 Unlock
Step: 3 Unlock