

1. FIGURE Q1 shows Highway 82 network connecting Town X and Y. The highway is currently...
Fantastic news! We've Found the answer you've been seeking!
Question:
Transcribed Image Text:
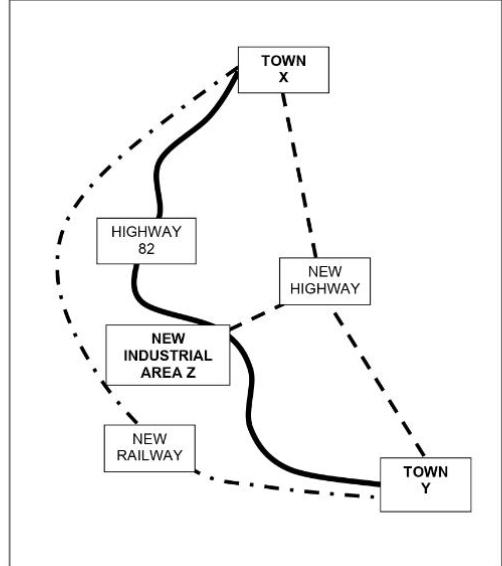
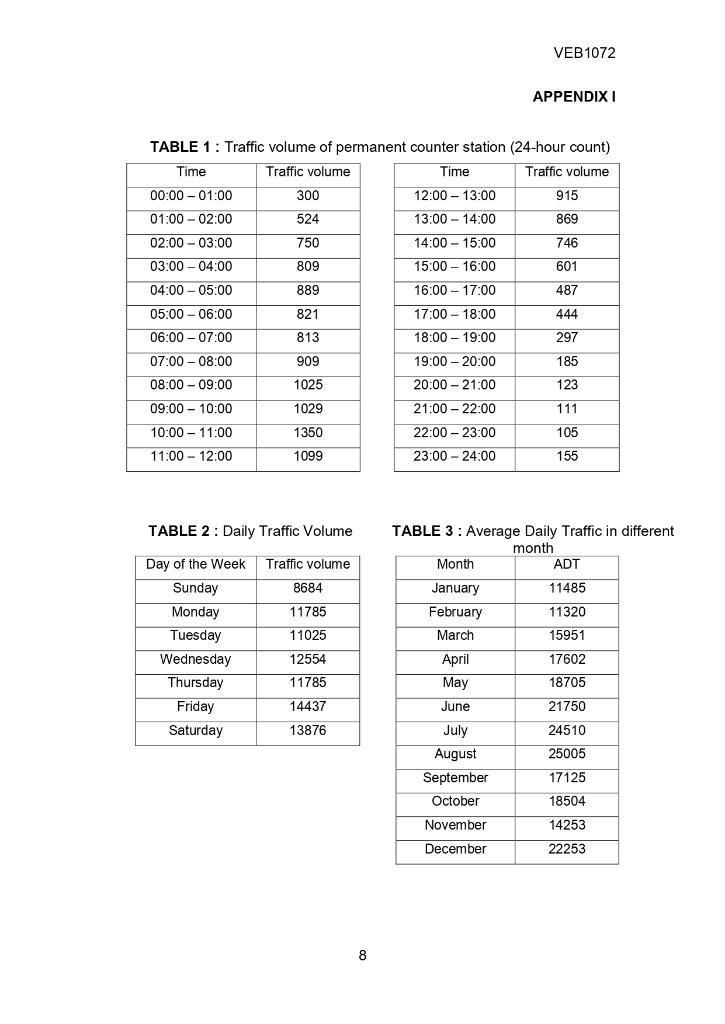
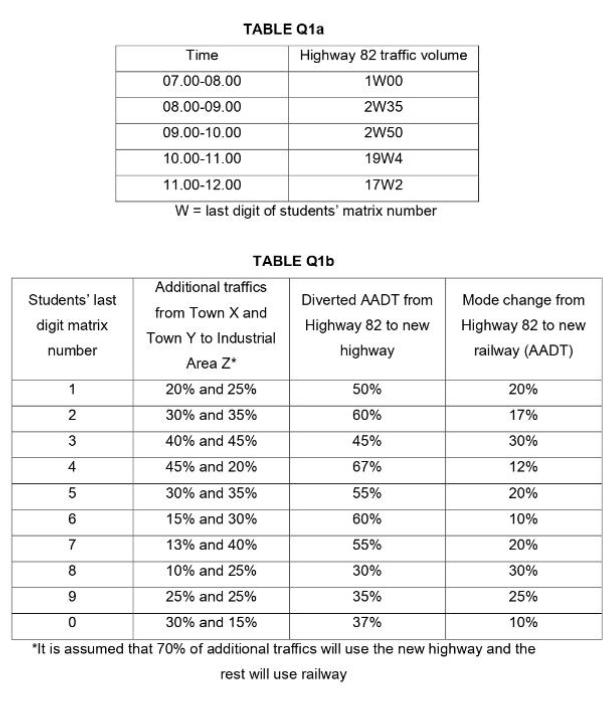
1. FIGURE Q1 shows Highway 82 network connecting Town X and Y. The highway is currently having LOS C and the government authority plans to develop an industrial area Z as shown in the figure. It is predicted that the new traffic demands generated by the industrial area would decrease LOS of the highway. Therefore, a new highway is planned to connect Town X, Town Y and the industrial area Z. Moreover, a railway is also planned to shift some travel demands of Town X to Town Y, Town X to Industrial Area Z, and Town Y to Industrial Z. Plan the new highway including the justifications on the type of highways and number of lanes. Analyse the Annual Average Daily Traffic (AADT) of Highway 82 from TABLE Q1a and adjust the AADT from the permanent counter station. Justify the Design Hour Volume (DHV) using information in TABLE Q1b. Outline the process in designing the cross-sections of the new highway with appropriate Level of Service (LOS). Use the traffic volume information in APPENDIX I. HIGHWAY 82 NEW INDUSTRIAL AREA Z NEW RAILWAY TOWN X NEW HIGHWAY TOWN Y Time 00:00 - 01:00 01:00 - 02:00 02:00-03:00 03:00-04:00 04:00-05:00 05:00-06:00 06:00-07:00 07:00-08:00 TABLE 1: Traffic volume of permanent counter station (24-hour count) Traffic volume Traffic volume 08:00 09:00 09:00 - 10:00 10:00 - 11:00 11:00 - 12:00 300 524 750 809 889 821 813 909 1025 1029 1350 1099 TABLE 2: Daily Traffic Volume Day of the Week Traffic volume Sunday Monday Tuesday Wednesday Thursday Friday Saturday 8684 11785 11025 12554 11785 14437 13876 8 Time 12:00 - 13:00 13:00 - 14:00 14:00-15:00 15:00 - 16:00 16:00 - 17:00 17:00-18:00 18:00-19:00 19:00 - 20:00 20:00-21:00 21:00 - 22:00 22:00-23:00 23:00 - 24:00 Month January February March VEB 1072 April May June APPENDIX I July August September October November December TABLE 3: Average Daily Traffic in different month 915 869 746 601 487 444 297 185 123 111 105 155 ADT 11485 11320 15951 17602 18705 21750 24510 25005 17125 18504 14253 22253 Students' last digit matrix number 1 2 3 4 5 6 7 8 9 TABLE Q1a 0 Time 07.00-08.00 08.00-09.00 09.00-10.00 10.00-11.00 11.00-12.00 W = last digit of students' matrix number Highway 82 traffic volume 1W00 2W35 2W50 19W4 17W2 TABLE Q1b Additional traffics from Town X and Town Y to Industrial Area Z* Diverted AADT from Highway 82 to new highway 20% and 25% 30% and 35% 40% and 45% 45% and 20% 30% and 35% 15% and 30% 13% and 40% 10% and 25% 25% and 25% 30% and 15% "It is assumed that 70% of additional traffics will use the new highway and the rest will use railway 50% 60% 45% 67% 55% 60% 55% Mode change from Highway 82 to new railway (AADT) 30% 35% 37% 20% 17% 30% 12% 20% 10% 20% 30% 25% 10% 1. FIGURE Q1 shows Highway 82 network connecting Town X and Y. The highway is currently having LOS C and the government authority plans to develop an industrial area Z as shown in the figure. It is predicted that the new traffic demands generated by the industrial area would decrease LOS of the highway. Therefore, a new highway is planned to connect Town X, Town Y and the industrial area Z. Moreover, a railway is also planned to shift some travel demands of Town X to Town Y, Town X to Industrial Area Z, and Town Y to Industrial Z. Plan the new highway including the justifications on the type of highways and number of lanes. Analyse the Annual Average Daily Traffic (AADT) of Highway 82 from TABLE Q1a and adjust the AADT from the permanent counter station. Justify the Design Hour Volume (DHV) using information in TABLE Q1b. Outline the process in designing the cross-sections of the new highway with appropriate Level of Service (LOS). Use the traffic volume information in APPENDIX I. HIGHWAY 82 NEW INDUSTRIAL AREA Z NEW RAILWAY TOWN X NEW HIGHWAY TOWN Y Time 00:00 - 01:00 01:00 - 02:00 02:00-03:00 03:00-04:00 04:00-05:00 05:00-06:00 06:00-07:00 07:00-08:00 TABLE 1: Traffic volume of permanent counter station (24-hour count) Traffic volume Traffic volume 08:00 09:00 09:00 - 10:00 10:00 - 11:00 11:00 - 12:00 300 524 750 809 889 821 813 909 1025 1029 1350 1099 TABLE 2: Daily Traffic Volume Day of the Week Traffic volume Sunday Monday Tuesday Wednesday Thursday Friday Saturday 8684 11785 11025 12554 11785 14437 13876 8 Time 12:00 - 13:00 13:00 - 14:00 14:00-15:00 15:00 - 16:00 16:00 - 17:00 17:00-18:00 18:00-19:00 19:00 - 20:00 20:00-21:00 21:00 - 22:00 22:00-23:00 23:00 - 24:00 Month January February March VEB 1072 April May June APPENDIX I July August September October November December TABLE 3: Average Daily Traffic in different month 915 869 746 601 487 444 297 185 123 111 105 155 ADT 11485 11320 15951 17602 18705 21750 24510 25005 17125 18504 14253 22253 Students' last digit matrix number 1 2 3 4 5 6 7 8 9 TABLE Q1a 0 Time 07.00-08.00 08.00-09.00 09.00-10.00 10.00-11.00 11.00-12.00 W = last digit of students' matrix number Highway 82 traffic volume 1W00 2W35 2W50 19W4 17W2 TABLE Q1b Additional traffics from Town X and Town Y to Industrial Area Z* Diverted AADT from Highway 82 to new highway 20% and 25% 30% and 35% 40% and 45% 45% and 20% 30% and 35% 15% and 30% 13% and 40% 10% and 25% 25% and 25% 30% and 15% "It is assumed that 70% of additional traffics will use the new highway and the rest will use railway 50% 60% 45% 67% 55% 60% 55% Mode change from Highway 82 to new railway (AADT) 30% 35% 37% 20% 17% 30% 12% 20% 10% 20% 30% 25% 10%
Expert Answer:
Answer rating: 100% (QA)
SOLUTION To plan the new highway connecting Town X Town Y and the industrial area Z several factors need to be considered including the existing traffic conditions projected traffic demands and desire... View the full answer

Posted Date:
Students also viewed these accounting questions
-
Figure 27.3 shows CCWs average daily call volume for each quarter of the past three years, and column F of Fig. 27.4 gives the seasonally adjusted call volumes. Management now wonders what these...
-
Figure Q30.31 shows two permanent magnets, each having a hole through its center. Note that the upper magnet is levitated above the lower one. (a) How does this occur? (b) What purpose does the...
-
Figure shows cross sections through two large, parallel, non-conducting sheets with identical distributions of positive charge with surface charge density = 1.77 x 10⁻²²C/m2. In unit-vector...
-
Should U.S. national forests become privatized (sold to private owners)? Why or why not?
-
What is meant by packaged information?
-
Indicate the effect (+, , or 0) on total stockholders equity of McKenzie Services Corporation for each of the following: 1. Declaration and issuance of a stock dividend on common stock 2. Sale of 100...
-
Prove by induction that \[\int_{0}^{T} B_{t}^{k} d B_{t}=\frac{B_{T}^{k+1}}{k+1}-\frac{k}{2} \int_{0}^{T} B_{t}^{k-1} d t\]
-
How do you calculate the percentage of change in sales from 20X8 to 20X9? This will go in cell D7? Show the formula. Kretsmart Common-Size Income Statements For the Years Ended December 31, 20'X'9,...
-
Write the equation of the line tangent to f(x)= 1 when x = 1.
-
An earlier version of the IBM mainframe, the S/390 G4, used three levels of cache.As with the z990, only the first level was on the processor chip [called the processor unit (PU)].The L2 cache was...
-
Santa Fe Retailing purchased merchandise from Mesa Wholesalers with credit terms of 2/10, n/60 and an invoice price of $16,800. The merchandise had cost Mesa $11,458. Assume that both buyer and...
-
The reason many homeowners cannot sell their homes when housing prices are falling is because ______. a) there are no buyers in the market b) there are too many houses on the market c) no one can get...
-
When market price is above equilibrium price, _______. a) market price will rise b) equilibrium price will rise c) market price will fall d) equilibrium price will fall
-
When supply rises and demand stays the same, _______. a) equilibrium quantity rises b) equilibrium quantity falls c) equilibrium quantity stays the same
-
At equilibrium price, quantity demanded is _____. a) greater than quantity supplied b) equal to quantity supplied c) smaller than quantity supplied
-
At equilibrium, quantity demanded is __________equal to quantity supplied. a) sometimes b) always c) never
-
Which of the following statements is true of a knowledge worker? Larger product life cycles create a need for the knowledge worker. This category of workers includes only product developers or...
-
Eleni Cabinet Company sold 2,200 cabinets during 2011 at $160 per cabinet. Its beginning inventory on January 1 was 130 cabinets at $56. Purchases made during the year were as follows: February . 225...
-
Explain how the miR-200 family of miRNAs behave as tumorsuppressor genes. What happens when their expression is blocked or decreased?
-
List five types of cancer in which ncRNAs can be involved.
-
Describe how lytic bacteriophages are released from their host cells.

Study smarter with the SolutionInn App