

Question: 1. Find the interquartile range and the mean absolute deviation of each data set. Line Plot X Line Plot Y Line Plot Z IQR: MAD
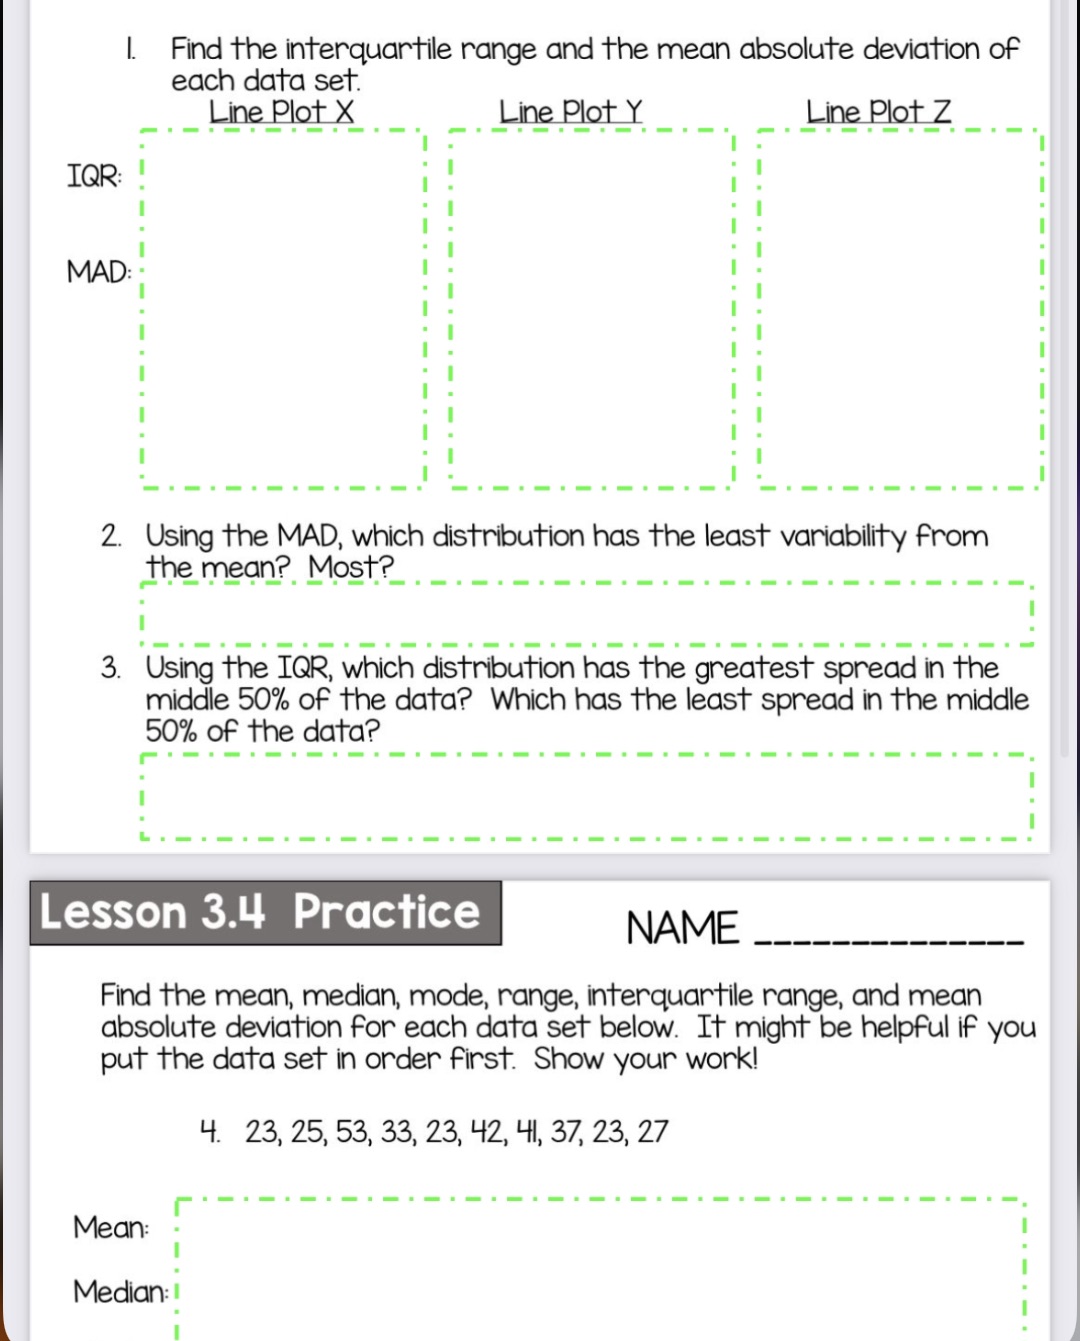
1. Find the interquartile range and the mean absolute deviation of each data set. Line Plot X Line Plot Y Line Plot Z IQR: MAD 2. Using the MAD, which distribution has the least variability from the mean? Most? 3. Using the IQR, which distribution has the greatest spread in the middle 50% of the data? Which has the least spread in the middle 50% of the data? Lesson 3.4 Practice NAME Find the mean, median, mode, range, interquartile range, and mean absolute deviation for each data set below. It might be helpful if you put the data set in order first. Show your work! 4. 23, 25, 53, 33, 23, 42, 41, 37, 23, 27 Mean Median
Step by Step Solution
There are 3 Steps involved in it
1 Expert Approved Answer
Step: 1 Unlock

Question Has Been Solved by an Expert!
Get step-by-step solutions from verified subject matter experts
Step: 2 Unlock
Step: 3 Unlock