

Question: 1. From 2013-2016, what was the total spending in each of the four calendar years? 2. In each of the years 2013 - 2016, how
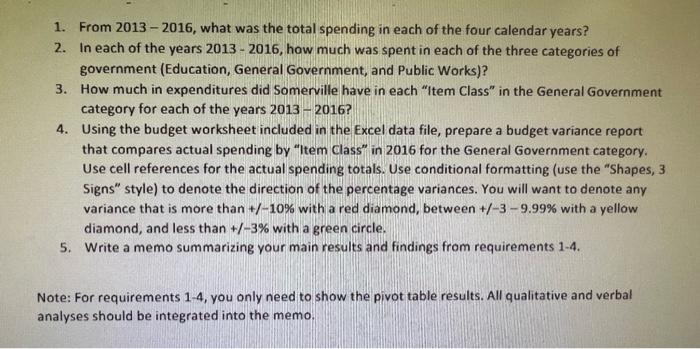
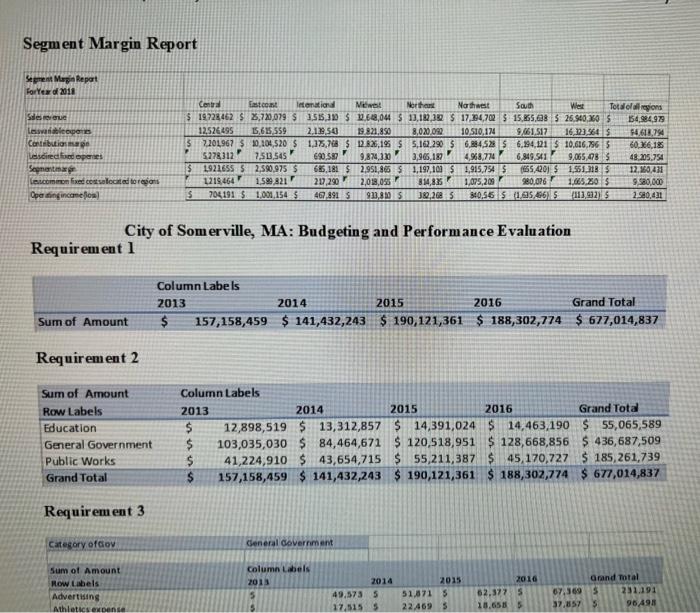
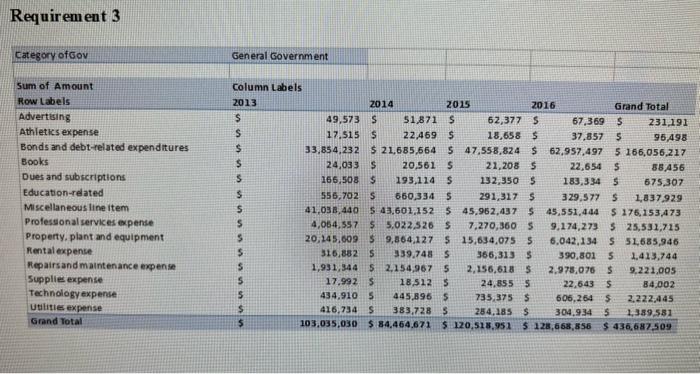
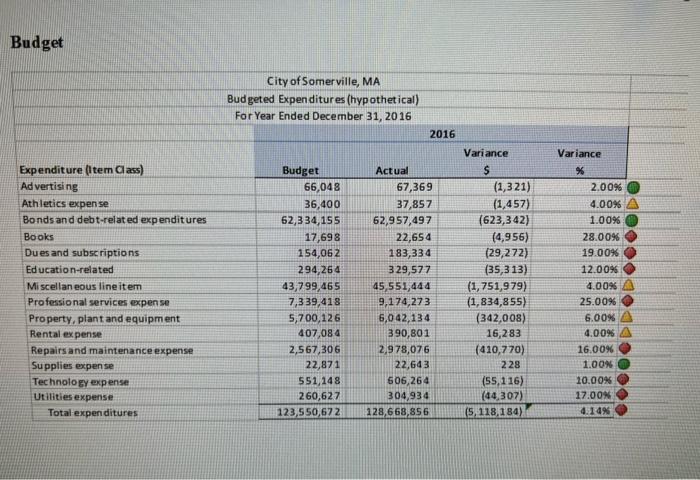
1. From 2013 - 2016, what was the total spending in each of the four calendar years? 2. In each of the years 20132016, how much was spent in each of the three categories of government (Education, General Government, and Public Works)? 3. How much in expenditures did Somerville have in each "Item Class" in the General Government category for each of the years 20132016 ? 4. Using the budget worksheet included in the Excel data file, prepare a budget variance report that compares actual spending by "Item Class" in 2016 for the General Government category. Use cell references for the actual spending totals. Use conditional formatting (use the "Shapes, 3 Signs" style) to denote the direction of the percentage variances. You will want to denote any variance that is more than +/10% with a red diamond, between +/39.99% with a yellow diamond, and less than +/3% with a green circle. 5. Write a memo summarizing your main results and findings from requirements 1-4. Note: For requirements 1-4, you only need to show the pivot table results. All qualitative and verbal analyses should be integrated into the memo. Segment Margin Report City of Somerville, MA: Budgeting and Performance Evaluation Requirement 1 Requirement 2 Requirem ent 3 Requirement 3 Budget 1. From 2013 - 2016, what was the total spending in each of the four calendar years? 2. In each of the years 20132016, how much was spent in each of the three categories of government (Education, General Government, and Public Works)? 3. How much in expenditures did Somerville have in each "Item Class" in the General Government category for each of the years 20132016 ? 4. Using the budget worksheet included in the Excel data file, prepare a budget variance report that compares actual spending by "Item Class" in 2016 for the General Government category. Use cell references for the actual spending totals. Use conditional formatting (use the "Shapes, 3 Signs" style) to denote the direction of the percentage variances. You will want to denote any variance that is more than +/10% with a red diamond, between +/39.99% with a yellow diamond, and less than +/3% with a green circle. 5. Write a memo summarizing your main results and findings from requirements 1-4. Note: For requirements 1-4, you only need to show the pivot table results. All qualitative and verbal analyses should be integrated into the memo. Segment Margin Report City of Somerville, MA: Budgeting and Performance Evaluation Requirement 1 Requirement 2 Requirem ent 3 Requirement 3 Budget
Step by Step Solution
There are 3 Steps involved in it

Get step-by-step solutions from verified subject matter experts