

Question: 1. generate position- time and acceleration time- data representing the motion of the object showing in figure 8. use the data to plot the corresponding
1. generate position- time and acceleration time- data representing the motion of the object showing in figure 8. use the data to plot the corresponding position- time and acceleration -time graphs.
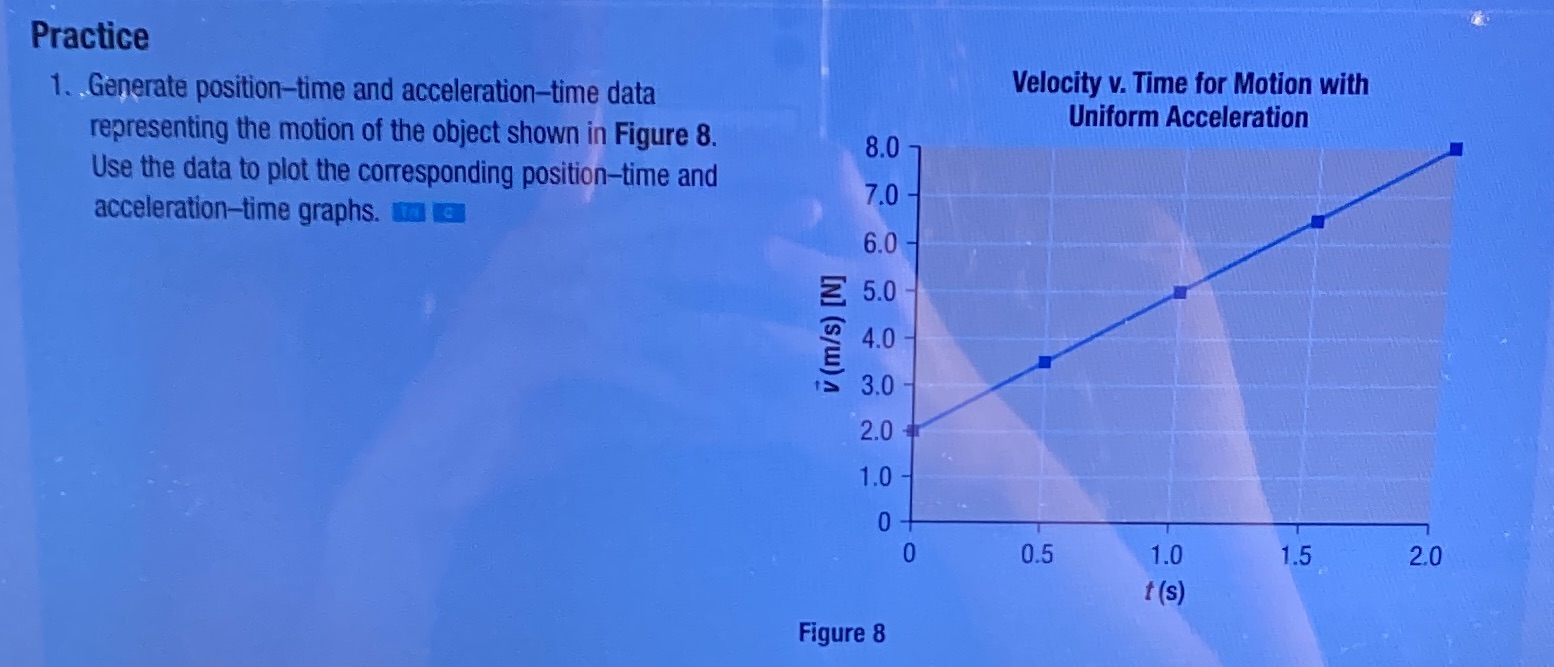
Practice 1. . Generate position-time and acceleration-time data Velocity v. Time for Motion with Uniform Acceleration representing the motion of the object shown in Figure 8. 8.0 Use the data to plot the corresponding position-time and 7.0 acceleration-time graphs. wa ka 6.0 5.0 v (m/s) [N] 4.0 3.0 2.0 1.0 10+ 0 0.5 1.0 1.5 2.0 t (s) Figure 8
Step by Step Solution
There are 3 Steps involved in it
1 Expert Approved Answer
Step: 1 Unlock

Question Has Been Solved by an Expert!
Get step-by-step solutions from verified subject matter experts
Step: 2 Unlock
Step: 3 Unlock