

Question: 1) Given the R graph (left) and the Y plot (Right), identify the orbital and draw the 90% probability cross section: R 10 20
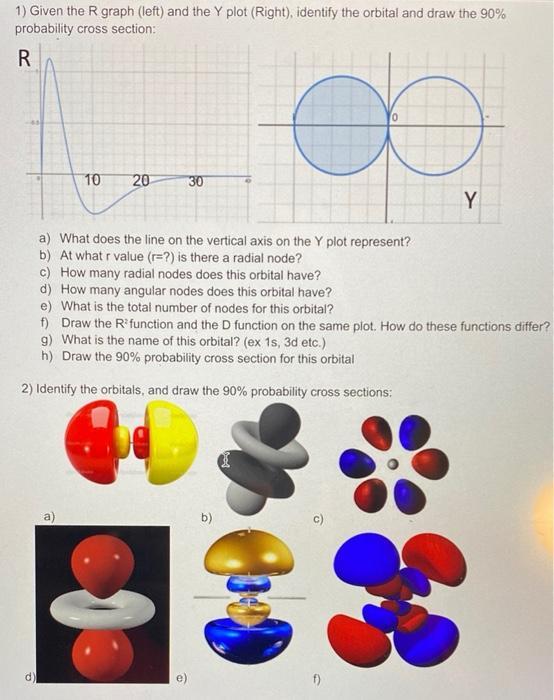
1) Given the R graph (left) and the Y plot (Right), identify the orbital and draw the 90% probability cross section: R 10 20 30 Y a) What does the line on the vertical axis on the Y plot represent? b) At what r value (r=?) is there a radial node? c) How many radial nodes does this orbital have? d) How many angular nodes does this orbital have? e) What is the total number of nodes for this orbital? f) Draw the R'function and the D function on the same plot. How do these functions differ? g) What is the name of this orbital? (ex 1s, 3d etc.) h) Draw the 90% probability cross section for this orbital 2) Identify the orbitals, and draw the 90% probability cross sections: a) b) d)
Step by Step Solution
3.46 Rating (156 Votes )
There are 3 Steps involved in it

Get step-by-step solutions from verified subject matter experts
Document Format (2 attachments)
6361905434f21_235913.pdf
180 KBs PDF File
6361905434f21_235913.docx
120 KBs Word File