

Question: 1. In Excel, create a Pivot Table using the data shown below. Use a New Sheet to creat the Pivot Table. 2. Show Columns for
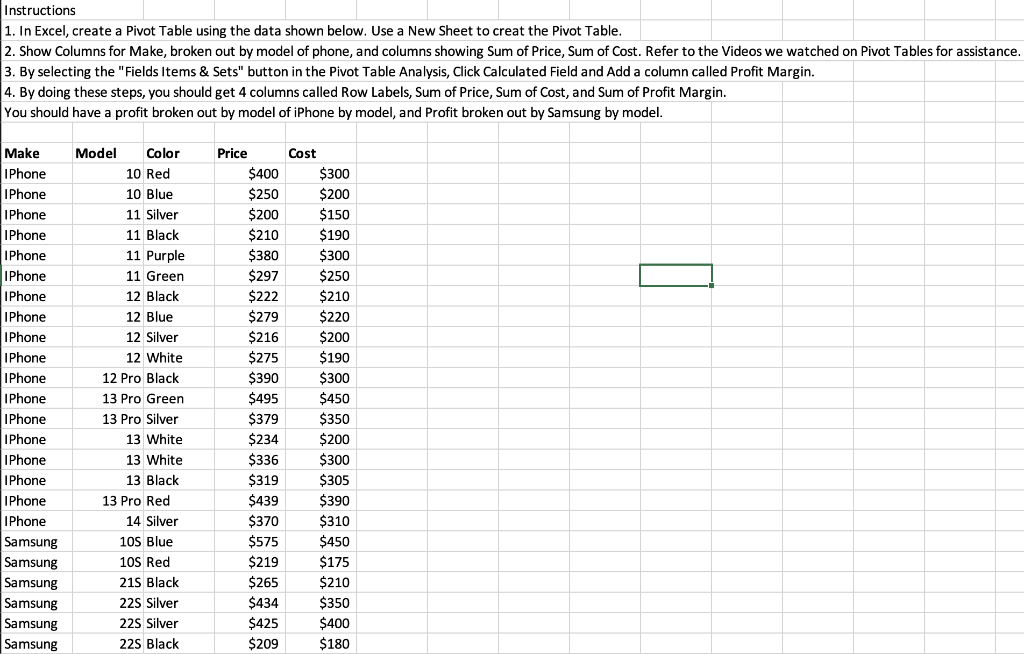
1. In Excel, create a Pivot Table using the data shown below. Use a New Sheet to creat the Pivot Table. 2. Show Columns for Make, broken out by model of phone, and columns showing Sum of Price, Sum of Cost. Refer to the Videos we watched on Pivot Tables for assistance. 3. By selecting the "Fields Items \& Sets" button in the Pivot Table Analysis, Click Calculated Field and Add a column called Profit Margin. 4. By doing these steps, you should get 4 columns called Row Labels, Sum of Price, Sum of Cost, and Sum of Profit Margin. You should have a profit broken out by model of iPhone by model, and Profit broken out by Samsung by model
Step by Step Solution
There are 3 Steps involved in it

Get step-by-step solutions from verified subject matter experts