

Question: 1. In the lecture, we wrote an R function to apply the batch gradient descent algorithm to fit a linear regression model describing the relationship
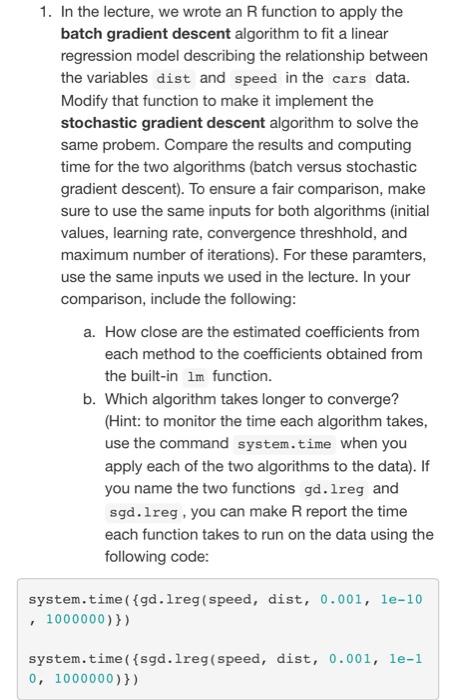
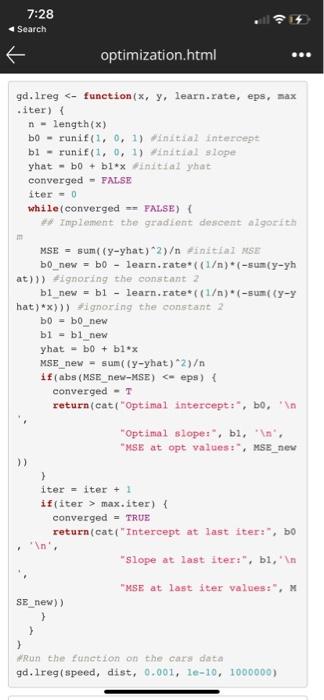
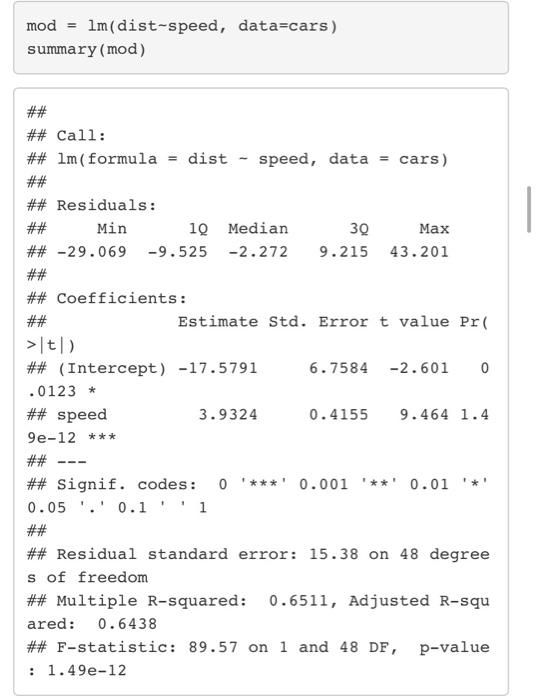
1. In the lecture, we wrote an R function to apply the batch gradient descent algorithm to fit a linear regression model describing the relationship between the variables dist and speed in the cars data. Modify that function to make it implement the stochastic gradient descent algorithm to solve the same probem. Compare the results and computing time for the two algorithms (batch versus stochastic gradient descent). To ensure a fair comparison, make sure to use the same inputs for both algorithms (initial values, learning rate, convergence threshhold, and maximum number of iterations). For these paramters, use the same inputs we used in the lecture. In your comparison, include the following: a. How close are the estimated coefficients from each method to the coefficients obtained from the built-in Im function. b. Which algorithm takes longer to converge? (Hint: to monitor the time each algorithm takes, use the command system.time when you apply each of the two algorithms to the data). If you name the two functions gd. Ireg and sgd.Ireg , you can make Rreport the time each function takes to run on the data using the following code: system.time({gd. Ireg( speed, dist, 0.001, le-10 1000000)}) system.time({sgd. lreg(speed, dist, 0.001, le-1 0, 1000000)}) 7:28 Search optimization.html gd.lreg > +ignoring the constant 2 bo = b0_new bl-bi_new yhat - bO + 51 x MSE_new - sum((y-yhat)2) if (abs (MSE_new-MSE) iter = iter + 1 if(iter > max. iter) { converged - TRUE return(cat("Intercept at last iter:", bo In' "Slope at last iter:", bi, 'n "MSE at last iter values:", M SE new) ) } > ) Run the function on the cars data gd. lreg(speed, dist, 0.001, le-10, 1000000) mod Im(dist-speed, data=cars) summary (mod) 30 ## ## Call: ## 1m (formula = dist - speed, data = cars) ## ## Residuals: ## Min 19 Median Max ## -29.069 -9.525 -2.272 9.215 43.201 ## ## Coefficients: ## Estimate Std. Error t value Pri >t) ## (Intercept) -17.5791 6.7584 -2.601 0 .0123 * ## speed 3.9324 0.4155 9.464 1.4 9e-12 *** ## ## Signif. codes: O ****' 0.001 '**' 0.01 0.05 '.' 0.1 'i ## ## Residual standard error: 15.38 on 48 degree s of freedom ## Multiple R-squared: 0.6511, Adjusted R-squ ared: 0.6438 ## F-statistic: 89.57 on 1 and 48 DF, p-value : 1.49e-12 1. In the lecture, we wrote an R function to apply the batch gradient descent algorithm to fit a linear regression model describing the relationship between the variables dist and speed in the cars data. Modify that function to make it implement the stochastic gradient descent algorithm to solve the same probem. Compare the results and computing time for the two algorithms (batch versus stochastic gradient descent). To ensure a fair comparison, make sure to use the same inputs for both algorithms (initial values, learning rate, convergence threshhold, and maximum number of iterations). For these paramters, use the same inputs we used in the lecture. In your comparison, include the following: a. How close are the estimated coefficients from each method to the coefficients obtained from the built-in Im function. b. Which algorithm takes longer to converge? (Hint: to monitor the time each algorithm takes, use the command system.time when you apply each of the two algorithms to the data). If you name the two functions gd. Ireg and sgd.Ireg , you can make Rreport the time each function takes to run on the data using the following code: system.time({gd. Ireg( speed, dist, 0.001, le-10 1000000)}) system.time({sgd. lreg(speed, dist, 0.001, le-1 0, 1000000)}) 7:28 Search optimization.html gd.lreg > +ignoring the constant 2 bo = b0_new bl-bi_new yhat - bO + 51 x MSE_new - sum((y-yhat)2) if (abs (MSE_new-MSE) iter = iter + 1 if(iter > max. iter) { converged - TRUE return(cat("Intercept at last iter:", bo In' "Slope at last iter:", bi, 'n "MSE at last iter values:", M SE new) ) } > ) Run the function on the cars data gd. lreg(speed, dist, 0.001, le-10, 1000000) mod Im(dist-speed, data=cars) summary (mod) 30 ## ## Call: ## 1m (formula = dist - speed, data = cars) ## ## Residuals: ## Min 19 Median Max ## -29.069 -9.525 -2.272 9.215 43.201 ## ## Coefficients: ## Estimate Std. Error t value Pri >t) ## (Intercept) -17.5791 6.7584 -2.601 0 .0123 * ## speed 3.9324 0.4155 9.464 1.4 9e-12 *** ## ## Signif. codes: O ****' 0.001 '**' 0.01 0.05 '.' 0.1 'i ## ## Residual standard error: 15.38 on 48 degree s of freedom ## Multiple R-squared: 0.6511, Adjusted R-squ ared: 0.6438 ## F-statistic: 89.57 on 1 and 48 DF, p-value : 1.49e-12
Step by Step Solution
There are 3 Steps involved in it

Get step-by-step solutions from verified subject matter experts